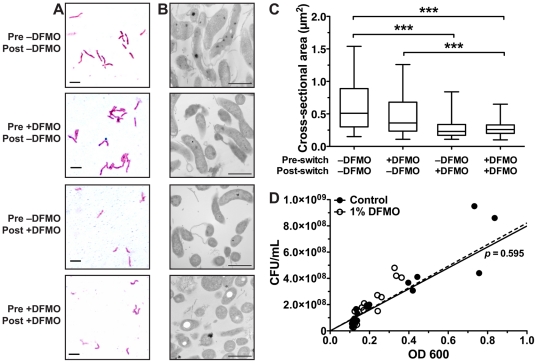
Figure 5. DFMO alters bacterial morphology.
Bacterial samples were removed from cultures 6 h after the medium switch depicted in Figure 4B. Gram stains were performed and examined by light microscopy (A) and bacterial pellets were fixed, sectioned, and stained for TEM (B). Note that the labels for panel A also apply to panel B. Scale bars indicate 2 µm in panel A and 1 µm in panel B. (C) Stained bacteria were examined by TEM and cross-sectional areas were measured. For each treatment group the box identifies the median and 25th and 75th percentile values and the whiskers indicate the range of measurements (n = 83–129 measurements per group). ***, p<0.001 between groups indicated. D, a plot of OD600 versus bacterial concentration in CFU/mL was created from the data points of the first 12 h of growth curves depicted in Figures 1B and 1C (n = 9 per treatment). The lines illustrate the best-fit linear regression of each treatment group (control, solid line; 1% DFMO, dashed line) constrained to pass through the origin. The two lines did not significantly differ (p = 0.595). The global best-fit line (not depicted, R2 = 0.80) indicated that an OD600 of 1 was equivalent to 8.11×10⁸ CFU/mL.

