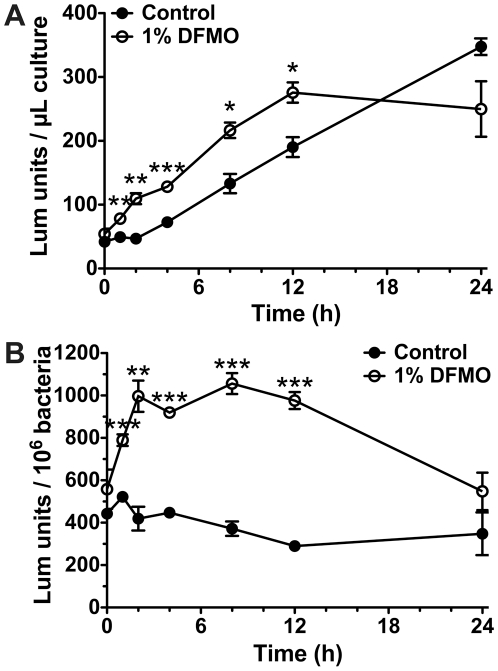
Figure 6. Metabolic activity is altered in H. pylori cultured with 1% DFMO.
Cultures were grown for 24 h and bacterial samples were removed at the indicated time points. Relative ATP levels were measured in bacterial lysates using CellTiter-Glo, a luciferase-based assay kit. (A) Luminescence (Lum) units, proportional to ATP concentration, were calculated for equivolumetric samples. (B) Luminescence units per 106 bacteria at each time point were calculated using the data from panel A, the observed OD600 of the culture, and the equation derived from Figure 5D . Each data point is the average of 3 experiments with the standard errors shown. For both graphs, *, p<0.05; **, p<0.01; ***, p<0.001 versus the control condition.

