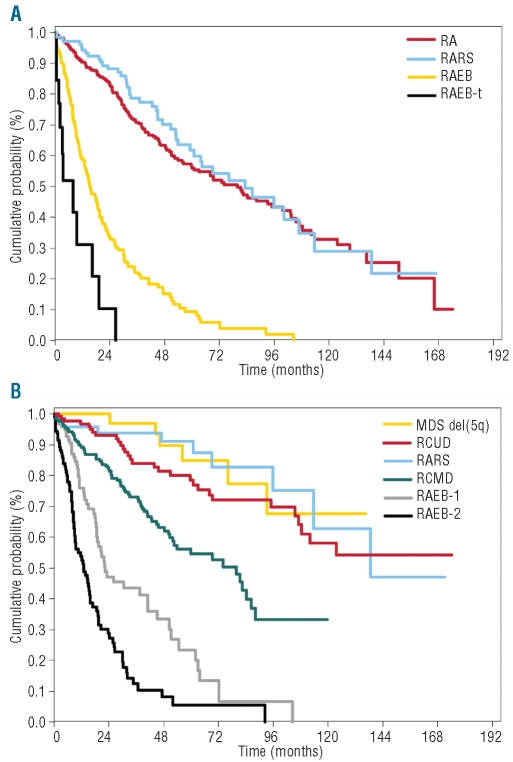
Figure 1.
Kaplan-Meier survival curves of 943 patients diagnosed with MDS according to the 2008 WHO criteria at the Department of Hematology Oncology, Fondazione IRCCS Policlinico San Matteo & University of Pavia, Pavia, Italy. (A) Patients grouped according to the FAB classification (patients with 5–19% bone marrow blasts and Auer rods were classified as RAEB-t). (B) Patients grouped according to the WHO classification. Patients classified as RA or RARS according to the FAB classification (panel A) are split here (panel B) into two subgroups with different survival based on the presence of unilineage [RCUD or RARS, including also MDS with del(5q)] or multi-lineage dysplasia (RCMD). Moreover, patients with RAEB (panel A) are also split here into two subgroups according to their blast percentage (5–9% in RAEB-1, 10–19% in RAEB-2).

