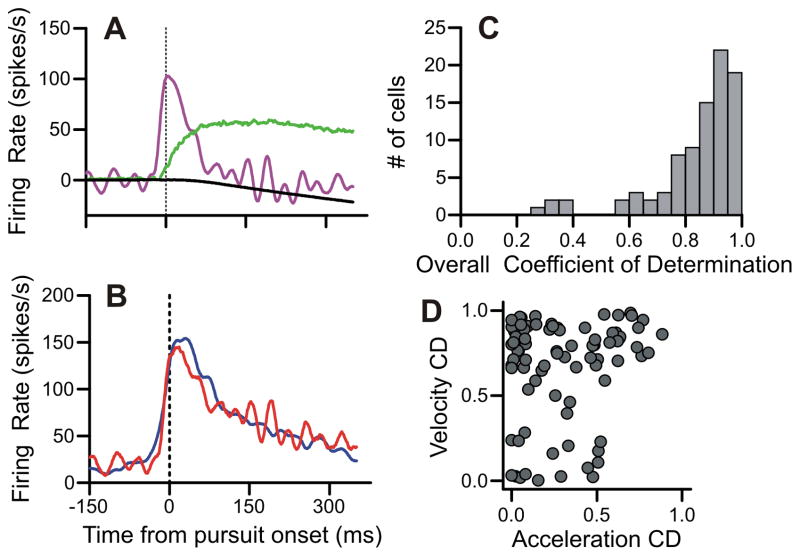
Figure 10.
Methodology for modeling firing rates with pursuit metrics A: Model parameters for an example cell. Eye acceleration (purple), velocity (green), and position (black) are plotted. B: Model fit (red) and experimental data (blue) for the example cell are illustrated. The equation for this model is FR(t) = 19.9 – 4.2*Position(t-14) + 3.2*Velocity(t-14) + 0.35*Acceleration(t-14). The acceleration, velocity, and position CDs for this model are 0.8, 0.74, and 0.45 respectively. The overall CD is 0.88. C: Histogram of overall CDs for all our neurons. D: Scatter plot of the velocity and acceleration CDs for all our cells. Position CDs are not used in our analysis and not plotted here.

