Figure 5.
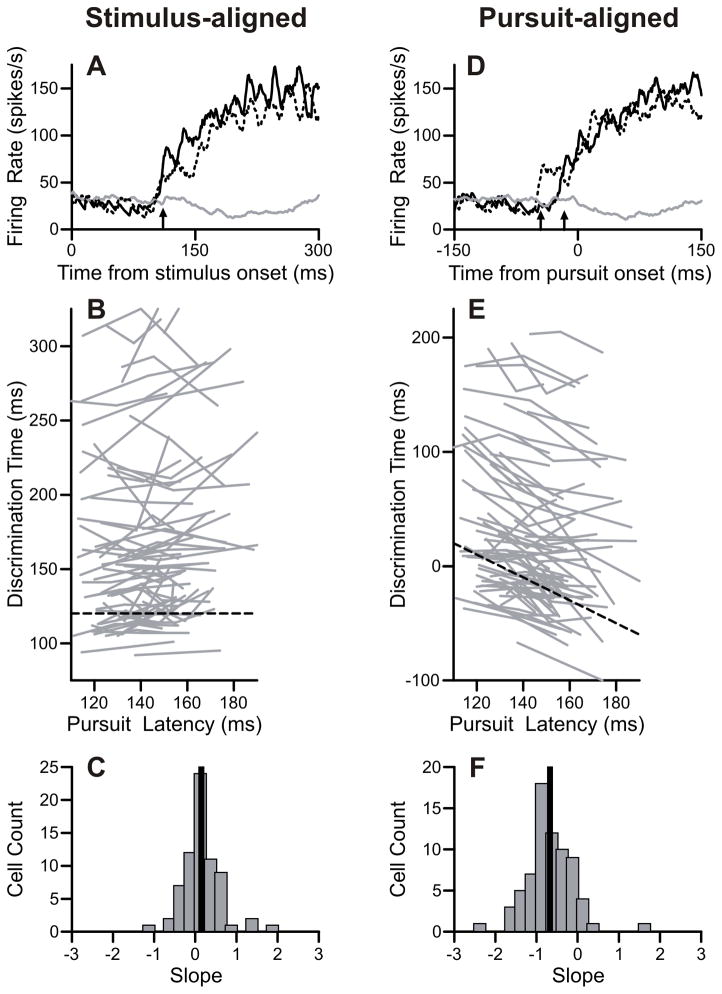
Buildup times varied with stimulus onset. A: Firing rates aligned on stimulus onset for an example neuron. Target-selection pursuit trials directed in the preferred direction (black) and target-selection saccade trials (gray). Target-selection pursuit trials were divided into three pursuit latency groups; quick (solid black) and slow (dotted black) trials are plotted here. Buildup onsets were identified as the discrimination time between pursuit and saccade trials, and are indicated with arrows for quick (110 ms) and slow (111 ms) pursuit latency trials. B: Population data of buildup onset times aligned on stimulus onset. Each gray line contains three points from the three pursuit latency groups. Black dashed line has a slope of zero. C: Slopes of regression lines from stimulus-aligned data. Black line is the median slope. D: Firing rates aligned on eye movement. Plotting conventions are the same as A. Buildup onsets for quick (-16ms) and slow (−43 ms) pursuit latency groups are indicated with arrows. E: Population data aligned on pursuit onset. Black dashed line has a slope of −1. Other conventions are the same as B. F: Slopes of regression lines from pursuit-aligned data. Same plotting conventions as C.

