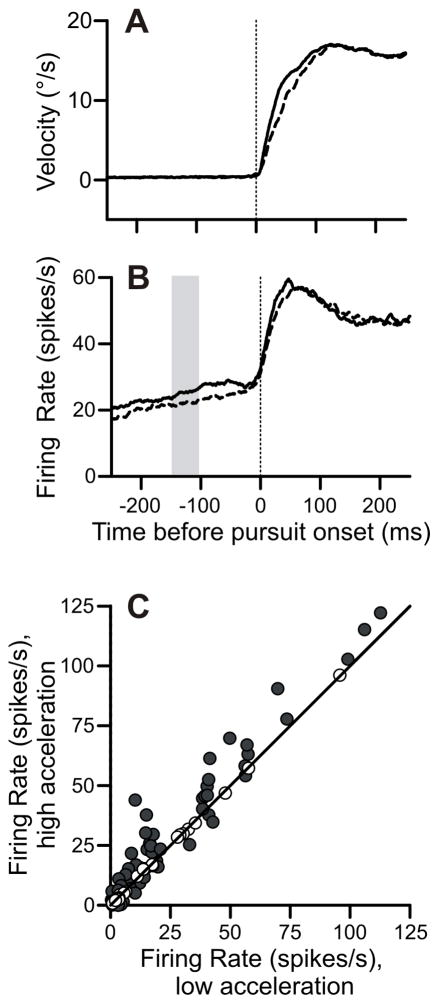
Figure 9.
Within-task variations of acceleration correlated with differences in firing rate buildup. A: Eye velocity trace for the pursuit-only task in the preferred direction aligned on pursuit onset. Solid and dashed lines represent trials with initial accelerations greater or less than the median, respectively. B: Firing rates corresponding to the high-acceleration (solid) and low-acceleration (dashed) groups of trials in preferred direction. Vertical gray bar is the measurement interval 150–100 ms prior to pursuit onset. C: Scatter plot of firing rates in the high-acceleration versus low-acceleration trials. Preferred direction only. Solid dots are significantly different than equality.

