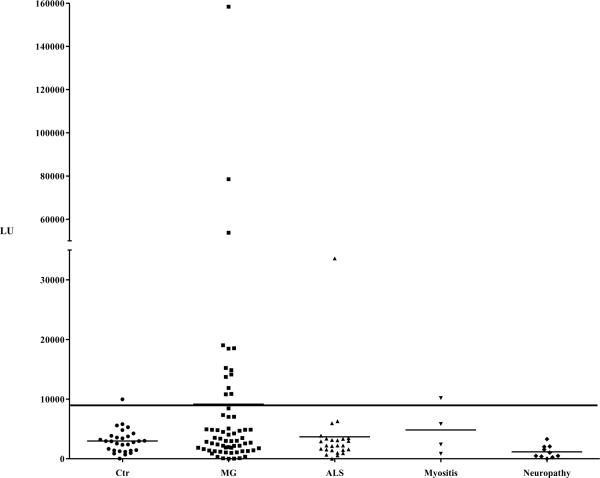
Figure 3. Detection of MG patient autoantibodies using AChR-α1-Δ5.
A larger cohort of MG patients (N=63) and controls (N=29) and disease controls (N=39) were screened using AChR-α1-Δ5. Each point represents the average amount of fusion protein immunoprecipitated in two independent experiments by each patient in LU. In each panel, the long solid line shows a cutoff based on the average of the control group plus three standard deviations. The shorter solid lines indicate the average of each group.

