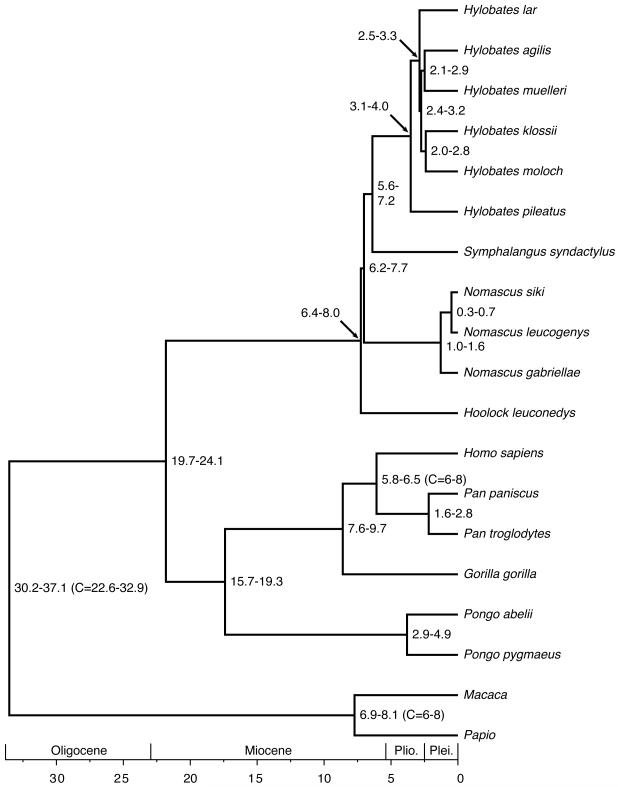
FIGURE 4.
Tree scaled to the molecular clock dates of each node. Numbers at nodes indicate the 95% Bayesian credibility interval from the posterior distribution. Three calibrations nodes are indicated with a ‘C=’ within brackets. The dates following the ‘C=’ correspond to the lower (2.5%) and upper (97.5%) bounds of the calibration prior distribution. Other parameter estimates given in Supplementary Materials. All dates are in Ma.

