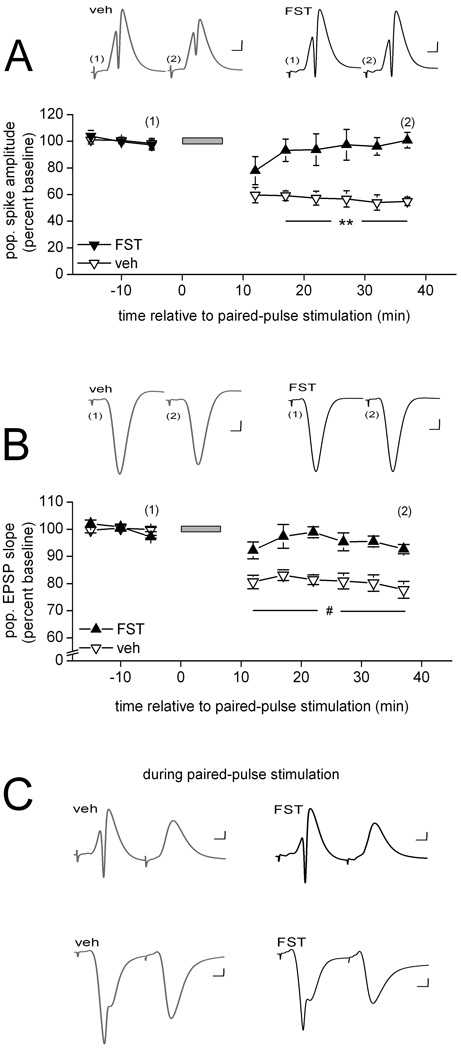
Figure 3.
Inhibition of PP2A also is sufficient to interfere with PPS-induced LTD in area CA1 in vivo. (A) Means ± SEMs of the amplitude of the population spike evoked by commissural stimulation before and after paired-pulse stimulation (PPS; grey horizontal bar) delivered to the same fibers. PPS was delivered in the presence of either vehicle solution (veh; open triangles; n = 5) or fostriecin (1–3 µM in the drug pipette; FST; filled triangles; n = 5). Representative waveforms (average of 10) collected from an animal in each of the two drug conditions at the times indicated in the line graph are shown above. Scale: horizontal, 4 msec; vertical, 1 mV. Post-hoc between-drug comparisons for the indicated time points: **, p < 0.01. (B) Similar data for the initial slope of the population EPSP evoked by commissural stimulation. As above, PPS was delivered in the presence of either vehicle solution (open symbols; n = 6) or fostriecin (filled triangles; n = 5). Representative waveforms (average of 10) collected from an animal in each of the two drug conditions at the times indicated in the line graph are shown above. Scale: horizontal, 4 msec; vertical, 1 mV. Post-hoc between-drug comparisons for the indicated time points: #, p < 0.02. (C) Representative waveforms evoked by a pair of pulses during PPS, averaged across the 200 pairs of the train and collected in either str. radiatum (top traces) or str. radiatum (bottom traces) in the presence of either vehicle solution (grey traces) or fostriecin (black traces). Scale: horizontal, 4 msec; vertical, 1 mV.

