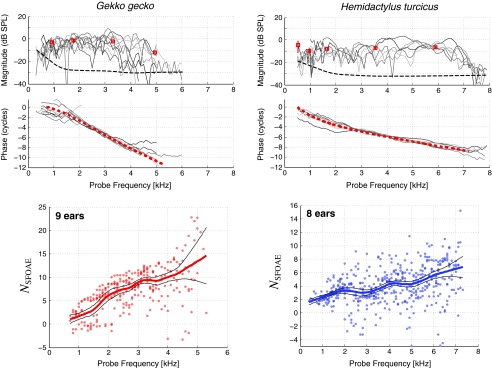
FIG. 1.
Compiled adult SFOAE data for both Gekko and Hemidactylus, evoked using a stimulus level of Lp = 20 dB SPL. Top plots show magnitude and phase (error bars of individual curves excluded for clarity, different individuals are shown via different shading intensities). Average magnitudes (and associated standard error) within octave-wide bins are indicated via the red square symbols (See “Methods”). Approximate noise floor is indicated via the dashed black line. Dashed red line for the phase indicates the NSFOAEloess trend integrated with respect to frequency, thereby providing the “average” phase response for visual comparison. Some phase curves have been offset vertically for clarity. Bottom plot (NSFOAE) indicates the phase-gradient delay (in cycles) as computed from the phase response. Only points whose magnitude was at least 10 dB above the noise floor were included. Solid line for NSFOAE plot is a locally weighted regression (loess) while solid black lines indicate the associated 95% confidence interval (see “Methods”). The total number of unique ears is indicated in the upper left corner of the NSFOAE plots. All data were obtained with lizards at a steady-state body temperature of ~32–33°C via a regulated heating pad. Other stimulus parameters used: Ls = 35 dB SPL, fs = fp + 40 Hz.

