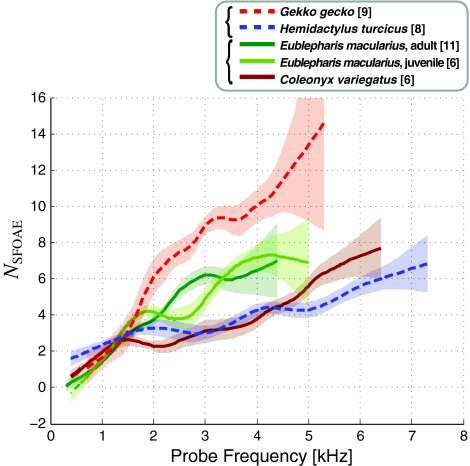
FIG. 4.
Comparison of SFOAE phase-gradient delays (expressed in # of stimulus cycles, NSFOAE) across gecko species (see caption to Fig. 1). Same data as shown in previous figures. Species within similar subfamily pairings are grouped by line style: Gekkoninae—dashed lines, Eublepharinae—solid lines. In figure legend, the number in brackets indicates number of unique ears included in the trend. Brackets on left of legend indicate same subfamily pairings as in Table 1. Shaded regions indicate associated 95% confidence interval. Probe level, Lp = 20 dB SPL.

