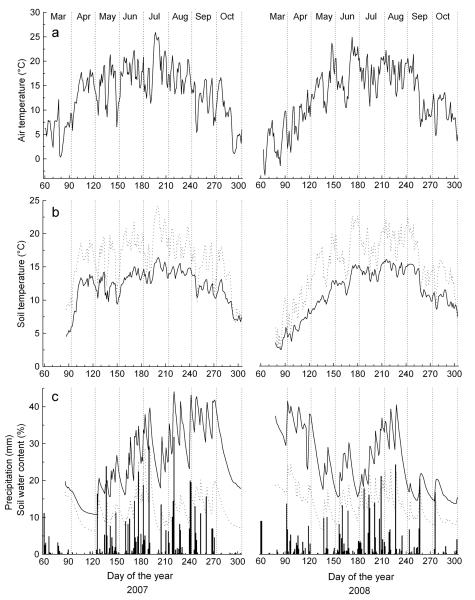
Figure 2.
Climate variables recorded during the growing seasons of 2007 and 2008 within the study area. a Mean daily air temperature b Mean daily soil temperature. c Daily precipitation sum (bars) and soil water content. In b-c study sites are denoted by dotted and solid lines for the xeric and dry-mesic site, respectively.

