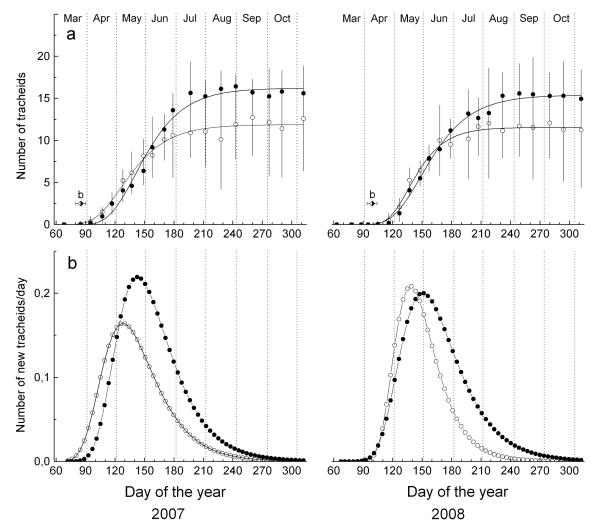
Figure 4.
a Dynamics of xylem growth (including enlarging, wall-thickening, and mature xylem cells) modelled by applying the Gompertz function in 2007 and 2008 at study plots. Time of bud break is indicated by symbol b. b Daily xylem growth rates calculated on the basis of modelled growth. Symbols as in Figure 3.

