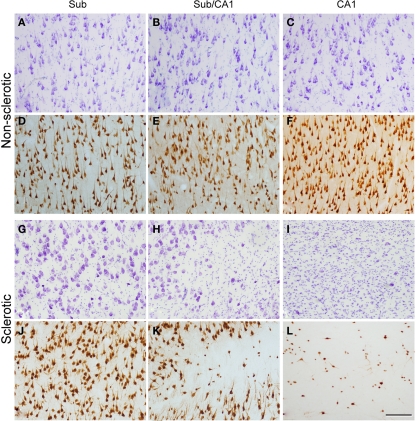
Figure 2.
Higher magnification of the regions indicated in Figure 1 and from an adjacent NeuN-immunostained section of the same regions from the non-sclerotic (A–F) and sclerotic (G–L) hippocampal formation. The non-sclerotic regions have a typical neuronal distribution, and the sclerotic subiculum (G,J) shows no apparent alterations. By contrast, the transitional subiculum/CA1 region (H,K) displays moderate neuronal loss and gliosis, and the sclerotic CA1 (I,L) exhibits severe neuronal loss and gliosis. Sub: subiculum, Sub/CA1: transitional subiculum/CA1 region. Scale bar [in (L)]: 180 μm.

