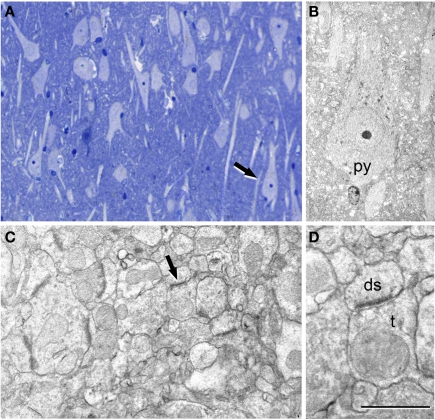
Figure 4.
Correlative light and electron microscopy of the subiculum region from a sclerotic hippocampus. (A) Photomicrograph of a 2-μm-thick semithin plastic section stained with 1% toluidine blue to show the numerous pyramidal cells. (B) Low-power electron micrograph taken after sectioning the semithin section shown in A, and illustrating the same pyramidal neuron (py) indicated with an arrow in (A). (C) Higher magnification of the adjacent neuropil shown in (B) to illustrate the numerous synapses. (D) Higher magnification of the asymmetric synapse (indicated with an arrow in C); ds, dendritic spine; t, axon terminal. Scale bar [in (D)]: 120 μm in (A), 58 μm in (B), 1 μm in (C), and 0.5 μm in (D).

