Figure 5.
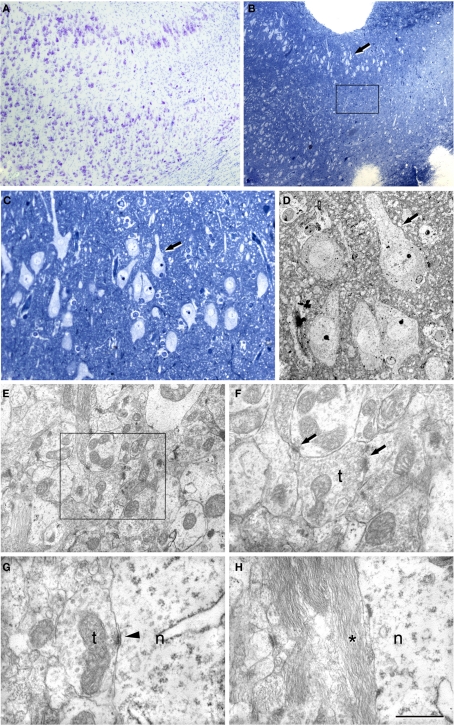
Correlative light and electron microscopy of the subiculum/CA1 region from a sclerotic hippocampus. (A) Photomicrograph of a Nissl-stained section showing the subiculum/CA1 region. (B) Photomicrograph of a 2-μm-thick semithin plastic section stained with 1% toluidine blue to show the gradual loss of neurons. Boxed area illustrates the sampling area for estimation of the synaptic density. (C) Higher magnification of (B). The arrow indicates the same group of neurons as those marked in (B). (D) Low-power electron micrograph of a section from the semithin preparation shown in (B,C) that illustrates the same group of pyramidal neurons. (E) Electron micrograph of the neuropil showing numerous synapses. (F) Higher magnification of the boxed area in (C) showing two synapses. (G,H) High power electron micrographs to illustrate the presence of symmetric synapses on a neuronal cell body (G) and the presence of the glial processes around them (H); n, neuronal cell body; t, axon terminal. Scale bar [in (H)]: 430 μm in (A), 340 μm in (B), 75 μm in (C), 19 μm in (D), 1.6 μm in (E), 0.8 μm in (F), 0.7 μm in (G), and 0.8 μm in (H).

