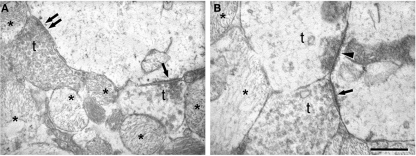
Figure 7.
Electron microscopy to illustrate the morphology of the synapses in the sclerotic CA1. (A) Normal symmetric synapse showing a typical thin postsynaptic density (double arrow). An asymmetric synapse (single arrow) displaying a characteristic thick postsynaptic density is found on the same postsynaptic element. (B) Electron micrograph illustrating axon terminals (t) forming synapses with different appearance. The arrow indicates an asymmetric synapse established by a normal-looking axon terminal. The arrowhead points to an asymmetric synapse whose presynaptic axon terminal has an abnormal appearance and in which virtually all synaptic vesicles are close to the synaptic junction. In (A) and (B), some processes of reactive glia are indicated by asterisks. t, axon terminal. Scale bar [in (B)]: 0.5 μm in (A) and 0.4 μm in (B).

