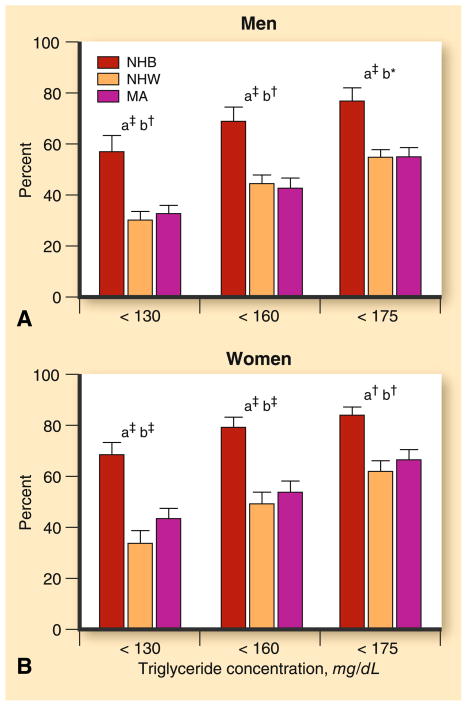
Fig. 2.
Percent of insulin-resistant individuals with triglyceride levels below threshold values by sex and ethnicity. Subjects were 2,804 participants of the National Health and Nutrition Examination Survey (NHANES) 1999–2000, including 569 non-Hispanic blacks (NHB), 1,485 non-Hispanic whites (NHW), and 750 Mexican Americans (MA). Insulin resistance was estimated as having a homeostasis model assessment (HOMA) in the upper tertile for the cohort. The letter “a” indicates a significant difference between NHB versus NHW; “b” indicates a significant difference between NHB versus MA; and “c” indicates a significant difference between NHW versus MA. Asterisk indicates a level of significance of <0.05; dagger indicates a level of significance of <0.01; and double dagger indicates a level of significance of <0.001. (From Sumner and Cowie [56•]; with permission)

