
Figure 4.
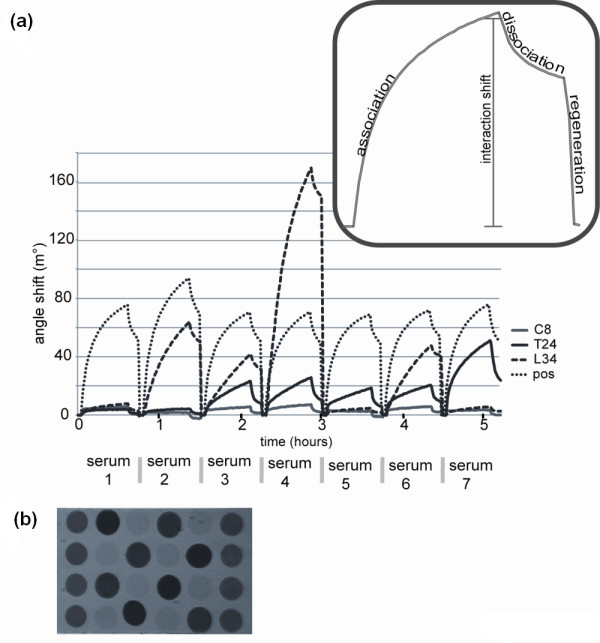
Analysis of autoantibody reactivity in patient sera by iSPR. (a) Sensorgrams showing the reactivity of seven sera to citrullinated peptides. The reactivity of seven RA sera with four different spots on the array was determined by iSPR monitoring. These spots contained either citrullinated fibrinogen fractions (C8, L34 or T24) or a positive control peptide (pos). In the sensorgrams the angle shifts in millidegrees (m°) are plotted as a function of time. (b) Reconstructed image of an iSPR sensorchip showing the resonance at 24 spots at a certain angle and a certain timepoint during scanning of the array.