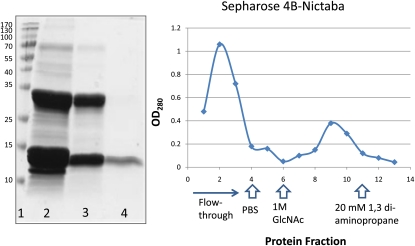
Figure 5.
Interaction of histone proteins with Nictaba-Sepharose 4B. The left panel shows affinity chromatography of histone proteins from calf thymus on Nictaba-Sepharose 4B. Lane 1, Molecular mass markers (Fermentas); lane 2, 50 μg of whole nonfractionated histone proteins from calf thymus; lane 3, flow through of the Nictaba column; lane 4, histone proteins eluted from the Nictaba column. The right panel shows the absorbance profile (OD280) of a Nictaba-Sepharose 4B column loaded with 10 mg of calf thymus histone proteins and eluted with 1 m GlcNAc and 20 mm 1,3-diaminopropane. [See online article for color version of this figure.]

