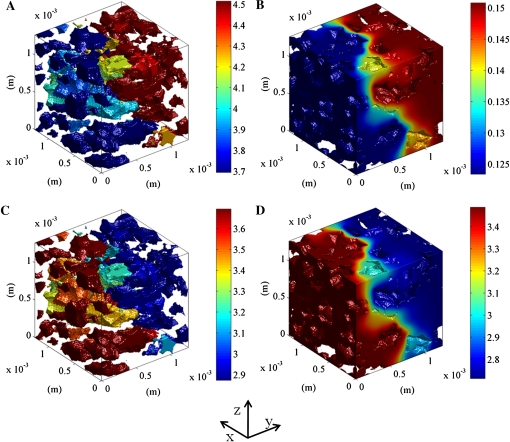
Figure 3.
Simulated O2 and CO2 concentrations in a typical sample of cortex tissue of apple Jonagold. At the left of the computational domain, the O2 and CO2 partial pressures were set to 9 kPa; at the right side, the O2 and CO2 partial pressures were set to 11 and 7 kPa, respectively, to ensure a partial pressure difference of 2 kPa for both gases. The lateral sides of the sample were assumed to be impermeable. A and C, O2 and CO2 concentrations in the intercellular space. B and D, O2 and CO2 concentrations in the cell. The color bar indicates the gas concentration (mol m−3).

