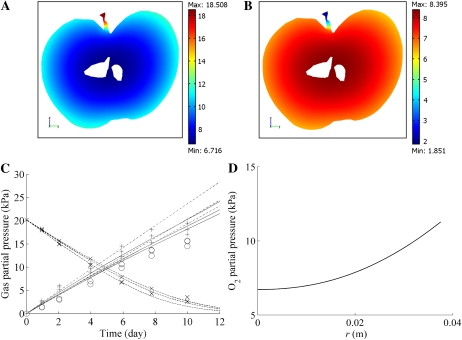
Figure 4.
A and B, O2 and CO2 partial pressure distribution in a vertical slice along the vertical axis of the fruit stored at 20 kPa O2, 0 kPa CO2, and 20°C. The macroscale model was used for the computation. Color bars indicate the gas partial pressure (kPa). C, O2 and CO2 concentrations as a function of time in a closed jar containing a Jonagold apple. The dashed lines and solid line indicate the computed O2 and CO2 partial pressures in the jar, respectively; crosses and circles indicate the measured O2 and CO2 gas partial pressures for initial conditions equal to 20 kPa O2, 0 kPa CO2, and 10°C. The dashed-dotted lines and plus symbols indicate the simulated and measured CO2 gas partial pressures in the jar, respectively, for initial conditions equal to 0 kPa O2, 0 kPa CO2, and10°C. For both sets of initial conditions, three experiments with different fruit were carried out and simulated. D, Radial O2 partial pressure profile in cortex tissue from the center to the boundary of the fruit (r = 38.6 mm). The O2 and CO2 concentrations of the external atmosphere were equal to 20 and 0 kPa CO2, respectively, and the temperature was 20°C.

