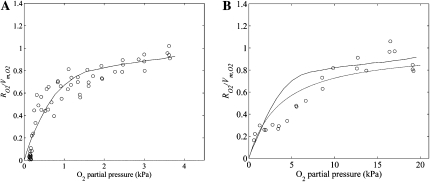
Figure 5.
Normalized O2 consumption (RO2/Vm,O2) of intact apple fruit as a function of the ambient O2 partial pressure at 1°C (A) and 10°C (B). Solid lines represent computed results from the multiscale model, while circles indicate the measurements. The dashed line in B represents the modeled Michaelis-Menten kinetics of O2 consumption of the intact apple at 10°C with Km,O2 = 3.76 kPa (Hertog et al., 1998).

