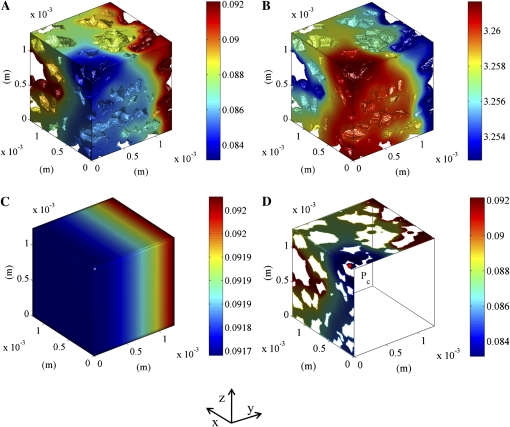
Figure 6.
Simulated intracellular O2 and CO2 concentration distributions in cortex tissue of a Jonagold apple near the core. The left side of the sample was assumed to be at the center of the apple and impermeable. At the right side, the partial pressure computed using the macroscale model at the corresponding position was applied (6.7219 kPa O2 and 8.392 kPa CO2). The other sides of the sample were assumed to be impermeable. The color bars indicate the gas concentrations (mol m−3). A and B, O2 and CO2 concentrations inside the cells, respectively. C, Simulated macroscopic O2 concentration. D, Cross section showing the O2 concentration inside the cell with an indication of the critical point Pc (minimal O2 and maximal CO2 in the tissue).

