Figure 2.
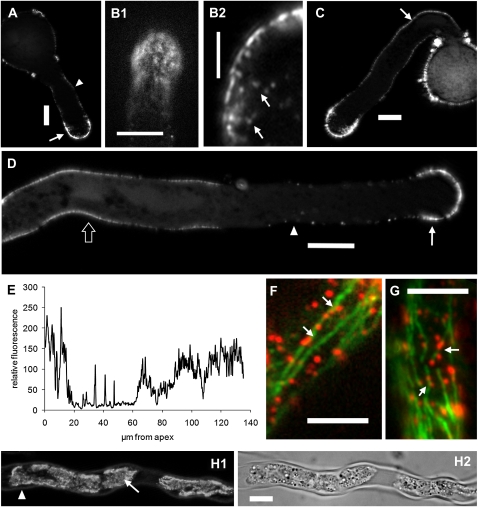
Distribution of CalS as shown by HDA antibody in immunofluorescence microscopy. Images in A, C, and D are single focal planes obtained in the tube center, while images in B and F are focused at the tube cortex. A, In short pollen tubes, labeling of CalS was mainly found in the cortical region of the apical domain (arrow); labeling extended approximately for the first 20 μm. This region was followed by less intense labeling, which was located in the cortex of pollen tubes and extended toward the pollen grain (arrowhead). B, Magnification of the apical region of pollen tubes showing the dotted distribution pattern of CalS. B1, Image of a single focal plane tangential at the tube surface. B2, Magnification of a focal plane in the tube center highlighting the presence of fluorescent spots in proximity of the tube apex (arrows). C, In longer pollen tubes, the slightly fluorescent region was followed by a distal region in which fluorescence intensity increased (arrow). D, In even longer tubes, the three-patterned distribution of CalS is more evident: the apical stronger region (arrow), the intermediate slighter region (arrowhead), and the distal intense region (bordered arrow); in all cases, staining is mainly cortical. E, Measurement of fluorescence intensity along the shank of pollen tubes, from the tip down to the base region. The three-segmented distribution of CalS is evident. F and G, In double labeling experiments performed on untreated pollen tubes, CalS (red, arrows) was sometimes found to colocalize with microtubules (green). Bars = 10 μm (A, B1, C, and D), 3 μm (B2), and 5 μm (F and G). H, Distribution of CalS in pollen tubes after plasmolysis. H1, Most of the CalS signal is found in the collapsing cytoplasm (arrow), and only a faint signal is found in the cell wall (arrowhead). H2, Corresponding DIC image. Bar = 10 μm.

