Figure 3.
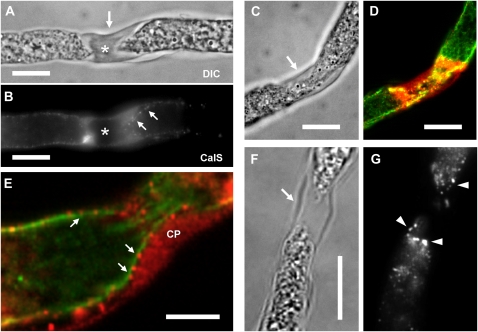
Localization of CalS in the callose plugs of pollen tubes. Longer pollen tubes (about 9 h of growth) were labeled by anti-CalS in order to analyze the distribution of CalS in comparison with callose plugs. A, A developing callose plug, which was observable using DIC microscopy (arrow). B, The same plug observed after immunostaining with anti-CalS showed a substantial increase of CalS on both sides, but labeling was absent on the central mature region of the plug (asterisk). On the side of the growing plug, CalS appeared as dots aligned along the border of the callose plug (arrows). Bars = 10 μm. C and D, One pollen tube with a developing callose plug (C, arrow) also showed a strong labeling by anti-CalS antibody around the plug (D; in red); MTs appeared as strands still passing through the narrow hole formed by the plug (D; in green). Bars = 10 μm. E, At higher magnification, CalS (in red) appeared as dots (arrows) aligned on cortical MTs (in green) on the side of the growing callose plug (CP). Bar = 5 μm. F and G, Analysis of Sus distribution at the level of callose plugs. When a callose plug formed (indicated by the arrow in the DIC image in F), the relative amount of Sus in its proximity increased significantly and prominent accumulation of Sus on both sides of the callose plugs was observed (G; arrowheads). Bar = 20 μm.

