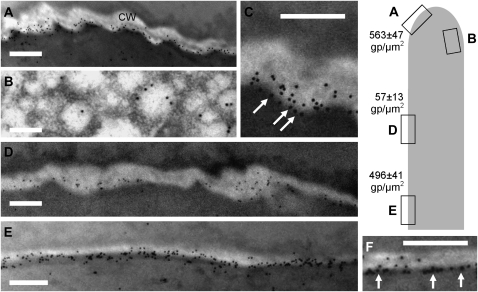
Figure 4.
Immunogold electron microscopy of CalS in pollen tubes. The drawing on the right indicates the approximate position of the electron micrographs and the density of gold particles (gp) μm−2 in each sample. A, View of the apical region of pollen tubes. A large number of gold particles can be observed; most of them are concentrated at the plasma membrane/cell wall (CW) interface. Bar = 350 nm. B, Labeling of CalS in the apical region, suggesting an association with vesicle-like structures. Bar = 150 nm. C, Magnification of labeling in the apical domain showing the presumptive association of gold particles with the plasma membrane (arrows). Bar = 250 nm. D, View of CalS distribution in the intermediate region. Few gold particles can be detected. Bar = 350 nm. E, View of distal regions of pollen tubes. The number of gold particles at the plasma membrane/cell wall interface increased considerably. Bar = 350 nm. F, When observed at higher magnification, gold particles in the distal region were lined up at the plasma membrane/cell wall interface (arrows), suggesting an association with the plasma membrane. Bar = 250 nm.

