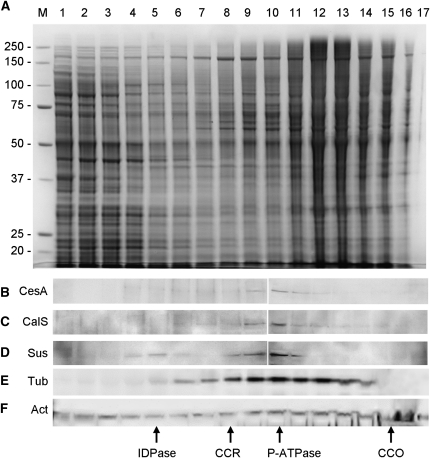
Figure 6.
Suc density gradient fractionation of pollen tube membranes. A, The microsomal fraction from 9-h-grown tobacco pollen tubes was centrifuged along 8% to 65% continuous Suc gradients and separated into approximately 20 fractions. Only 17 out of 20 fractions are shown on the SDS-PAGE gel (fraction 1 corresponds to 8% Suc, and fraction 17 corresponds roughly to 57% Suc). Molecular mass markers in kD (M) are on the left. Equivalent volumes were loaded. B, Immunoblot with anti-CesA antibody on the same fractions. The 125-kD band is found in fractions 8 to 13. C, Immunoblot with HDA antibody, which detected CalS in fractions 8 to 12. D, Immunoblot with K2 antibody against Sus; the enzyme peaked around fractions 8 to 12, while a small secondary peak was found in fractions 4 and 5. E, Immunoblot with anti-tubulin antibody showing the distribution of pollen tubulin. F, Immunoblot with anti-actin antibody. The positions of enzyme markers specific for different cellular compartments are also indicated: inosine-5′-diphosphate (IDPase) for Golgi membranes,cytochrome c reductase (CCR) for endoplasmic reticulum, P-ATPase for plasma membrane, and cytochrome c oxidase (CCO) for mitochondria.

