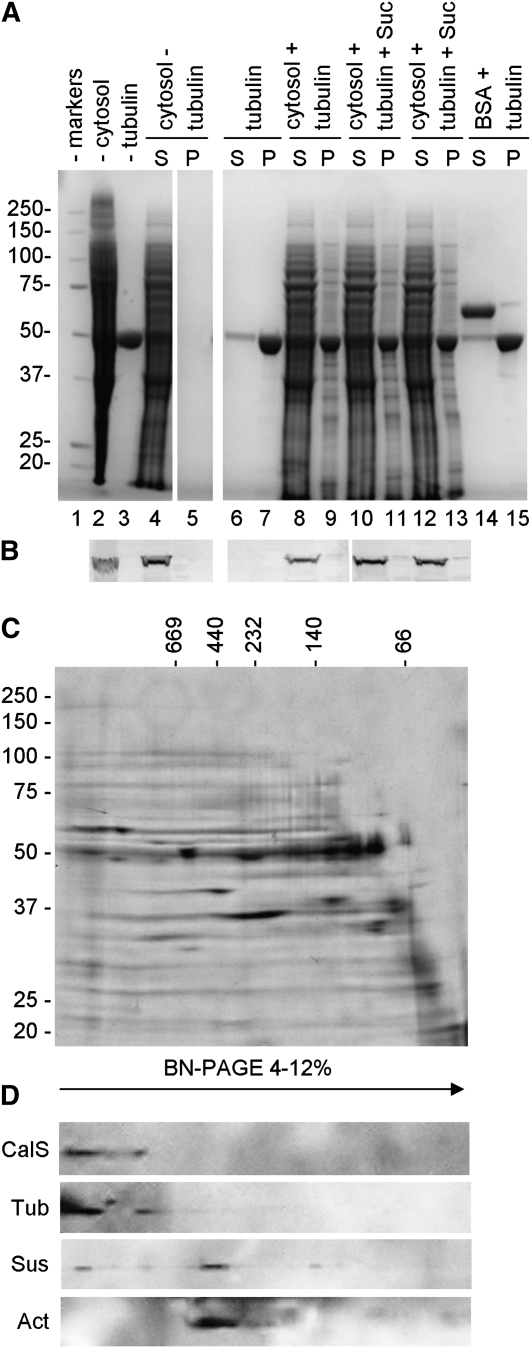
Figure 8.
Binding of cytoplasmic Sus to microtubules and analysis of CalS complex by Blue Native-PAGE. A, SDS-PAGE of the binding assay of Sus to microtubules. For clarity, the content of lanes is explained together with information for B. S, Supernatant; P, pellet. B, Immunoblot with anti-Sus on some of the fractions shown in A. Lane 1, Molecular mass markers. Cytosolic proteins (lane 2; 20 μg) assayed in the absence of microtubules (lane 3; 7 μg) did not sediment (lanes 4 and 5). When microtubules were added in the absence of Suc (lanes 8 and 9), part of cytosolic proteins bound to MTs and sedimented but Sus was still found in the supernatant (B, lanes 8 and 9). The presence of Suc in the mix did not allow Sus to sediment with MTs (40 mm Suc in lanes 10 and 11, 100 mm Suc in lanes 12 and 13). The behavior of Sus was similar to that of the control protein BSA (lanes 14 and 15). Lanes 6 to 7, Control of microtubule sedimentation activity. All lanes in A are from the same gel. C, Blue Native-PAGE of plasma membrane proteins separated according to their native molecular mass along 4% to 12% gels (horizontal axis) and then by standard SDS-PAGE on 10% gels (vertical axis). Standards of native molecular mass are indicated on top, while SDS-PAGE standards are indicated on the left. D, Immunoblot with antibodies to CalS, tubulin, Sus, and actin showing their relative migration after Blue Native (BN)-PAGE. Tubulin and CalS cosedimented in a higher molecular mass region around 1,600 kD, while Sus and actin cosedimented around 500 kD.

