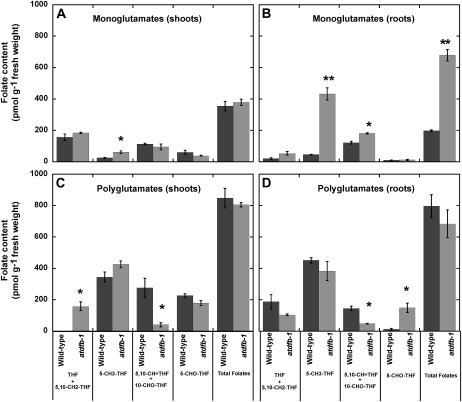
Figure 9.
Folate glutamylation profile in shoots and roots of 15-d-old Arabidopsis seedlings. Each folate class and total folates are presented as monoglutamates (A and B) or polyglutamates (C and D). Monoglutamyl contribution to each folate class was calculated by subtracting deglutamylated values from monoglutamyl quantification in polygutamylation profile analysis. Data are means ± se of three independent preparations. Asterisks indicate statistically significant differences (Student’s t test, * P < 0.05, ** P < 0.001).

