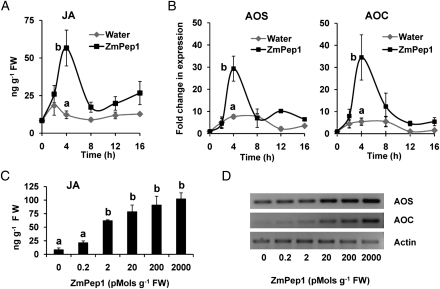
Figure 2.
ZmPep1 induces JA accumulation and regulates the expression of related biosynthetic genes. A and B, Time-course analysis of JA levels (A) and AOS and AOC gene expression (B) in excised leaves supplied with water or ZmPep1 (2 nmol g−1 fresh weight). Relative transcript abundance levels were examined using semiquantitative PCR with actin as a control. C and D, Dose dependence of JA levels (C) and AOS and AOC gene expression (D) in response to ZmPep1 at 4 h. Each sample was a pool of two leaves (n = 3; ±se). At the time point of greatest mean change, different letters (a and b) represent significant differences (all ANOVAs, P <0.02; Tukey test corrections for multiple comparisons where applicable, P < 0.05). FW, Fresh weight.

