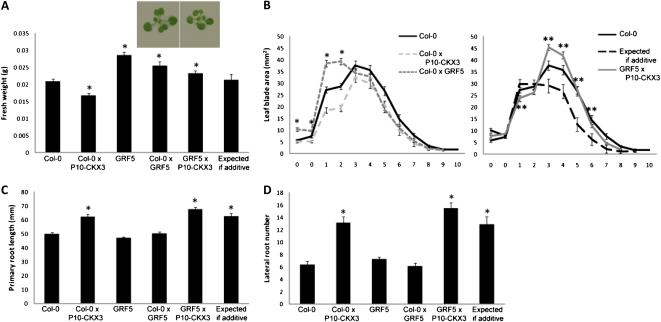
Figure 4.
Leaf and root growth phenotypes of plants cooverexpressing P10-CKX3 and GRF5. A and B, Shoot growth measurements at 21 DAS from plants grown in vitro. A, Rosette fresh weight. Photographs were taken from the rosettes of the heterozygous parent and the cross grown for 18 d in vitro. B, Blade area of cotyledons (0) and leaves 1 to 10 calculated from leaf series. C and D, Root growth measurements of plants grown on vertical plates under in vitro conditions for 9 d. C, Primary root length. D, Lateral root number. Values expected if additive were calculated as the sum of the single heterozygous lines minus the wild type (Col-0). Asterisks indicate values significantly different from the wild type (*) and from the value expected for an additive effect (**) by Student’s t test (P < 0.05 [A and B] and P < 0.01 [C and D]). Error bars indicate se (n ≥ 16 [A and B] and n ≥ 23 [C and D]). [See online article for color version of this figure.]

