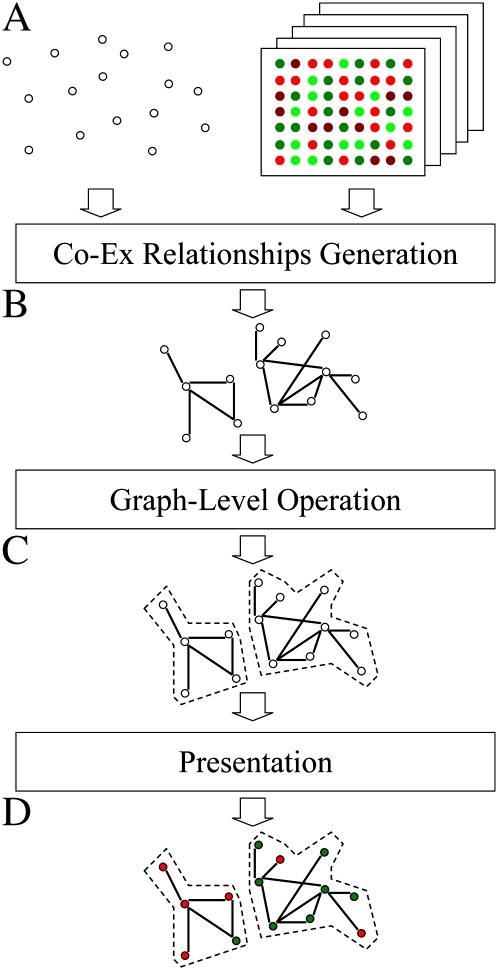
Figure 1.
Outline of the MACCU toolkit. A, Input data: a gene list (white nodes) and normalized microarray data from public databases. B, Coexpression relationships are identified by pairwise comparison of genes. Nodes without any relationships are removed. C, Generation of gene networks. D, Biologically meaningful information, such as gene symbols and colors indicating fold changes, can be added to the image. [See online article for color version of this figure.]

