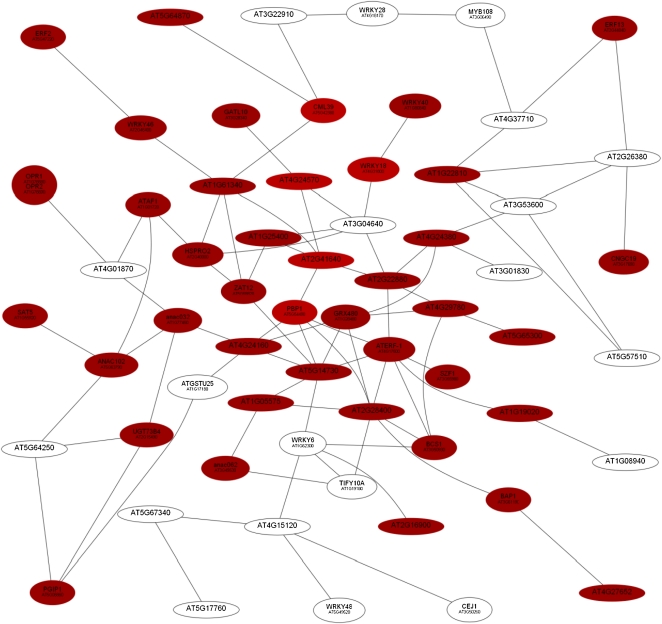
Figure 2.
Coexpression relationships of genes in RM1. The red nodes indicate up-regulated genes, and the white nodes represent genes that are not differentially expressed at this time point. The figure shows the expression of genes 1 h after transfer to Pi-deplete medium. [See online article for color version of this figure.]

