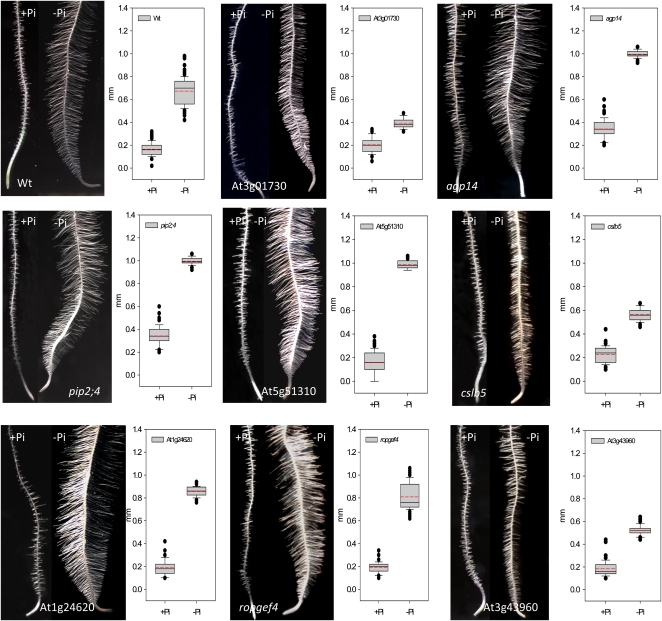
Figure 8.
Phenotypes and root hair lengths of mutants harboring defects in genes from RM2. Black lines in the box plots indicate the median, and red lines indicate the mean. One hundred root hairs from five roots were measured for each genotype and growth type. P < 0.001 (Student’s t test) indicates a significant difference from the wild type (Wt). [See online article for color version of this figure.]

