Abstract
The effect of the presentation of similar images for distinction between benign and malignant masses on mammograms was evaluated in the observer performance study. Images of masses were obtained from the Digital Database for Screening Mammography. We selected 50 benign and 50 malignant masses by a stratified randomization method. For each case, similar images were selected based on the size of masses and the similarity measures. Radiologists were shown images with unknown masses and asked to provide their confidence level that the lesions were malignant before and after the presentation of the similar images. Eleven observers, including three attending breast radiologists, three breast imaging fellows, and five residents, participated. The average areas under the receiver operating characteristic curves without and with the presentation of the similar images were almost equivalent. However, there were many cases in which the similar images caused beneficial effects to the observers, whereas there were a small number of cases in which the similar images had detrimental effects. From a detailed analysis of the reasons for these detrimental effects, we found that the similar images would not be useful for diagnosis of rare and very difficult cases, i.e., benign-looking malignant and malignant-looking benign cases. In addition, these cases should not be included in the reference database, because radiologists would be confused by these unusual cases. The results of this study could be very important and useful for the future development and improvement of a computer-aided diagnosis system.
Key words: Similar images, computer-aided diagnosis, breast masses, mammograms
Introduction
Mammography is considered an effective screening method for early detection of breast cancers for women at general risk. When a radiologist finds a lesion, he or she may decide whether the lesion is sufficiently suspicious to require further examinations such as ultrasound imaging, breast magnetic resonance imaging (MRI), or breast biopsy. However, the differential diagnosis of breast lesions on mammograms can be difficult; breast cancers are sometimes misinterpreted as benign, and many patients with benign lesions are sent for biopsy.1–3 Misinterpretation of breast cancers delays treatment, and unnecessary biopsy may increase patients’ anxiety, morbidity, and health-care cost.
For improvement of diagnostic accuracy, computer-aided diagnosis (CAD), in which the results of computer analysis of medical images are presented as a “second opinion” to diagnosing radiologists, has been studied. Studies by Chan et al.4 and Jiang et al.5 showed that CAD was useful for diagnosis of breast masses and clustered microcalcifications, respectively, on mammograms. In these studies, the computed likelihood of malignancy of the lesions was presented to radiologists. By use of receiver operating characteristic (ROC) analysis, the areas under the ROC curves in reading with CAD were improved compared to those for reading without CAD. It is desirable that the diagnostic accuracy of a radiologist with CAD would be higher than those both by radiologist alone and computer alone, and thus having the synergistic effect. However, in these studies,4,5 the diagnostic performances of all, except one, of the radiologists with CAD were lower than those by the computer. Some radiologists may not utilize effectively the likelihood of malignancy, possibly because the basis of the computer analysis was not presented, and radiologists may wonder why the computer estimate is high or low.
Radiologists’ diagnostic skills are commonly based on their experience in clinical practice and on observing cases in teaching files and textbooks. Therefore, if the images of lesions with known pathology similar to that of a new unknown lesion are presented to radiologists, comparison of the unknown image to the similar images may be helpful in the diagnosis of the lesion.6–10 The presentation of similar images as a diagnostic aid has been suggested for diagnosis of chest radiographs,11,12 lung computed tomography images,13 and mammograms 14–17. Some of these studies12–14,18 indicated the usefulness of similar images.
We have been investigating computerized methods for selection of visually similar images that would be helpful to radiologists in the distinction between benign and malignant lesions on mammograms.19–21 The uniqueness of our method is that we determined the similarity measure based on breast radiologists’ subjective similarity ratings. This similarity measure, called a psychophysical similarity measure, was determined by use of an artificial neural network (ANN) which was trained to learn the relationship between the image features and the average subjective similarity ratings provided by ten breast radiologists.20,21 By use of the subjective ratings in the training of the ANN, it may be possible to determine similarity measures that would agree well with the radiologists’ impression of similarity. In fact, the correlation coefficient between the subjective similarity ratings and the psychophysical similarity measures was higher than that between the subjective ratings and the similarity measure based on the closeness of the image feature values, which is most commonly used.20 In addition, the determination of the similarity measures may be further improved if the BI-RADS descriptors are provided consistently and included as the image features.21
In this study, we evaluated the effect of providing similar images in the distinction between benign and malignant masses on mammograms in an observer performance study. In previous studies,12,14,18 the similar-image selection schemes used were different, and similar images were presented along with other computer analysis results, such as the likelihood of malignancy. Therefore, it is uncertain whether radiologists were influenced by the similar images or by the other information. We evaluated the effect of the presentation of similar images selected based on a psychophysical similarity measure, which was determined by the ANN trained with 300 pairs of masses in our previous study.20
Materials and Methods
Case Selection
Images of masses were obtained from the Digital Database for Screening Mammography (DDSM),22 which is available at the University of South Florida website.23 A region of interest (ROI) 5 × 5 cm in size was extracted for each mass based on the outline provided in the DDSM. The ROIs were unified to the matrix size of 1,000 x 1,000 pixels with the pixel size of 50 µm. The images obtained from cranio-caudal views and medio-lateral oblique views were used independently; however, the images from the same patient were not employed as an unknown image and its similar images. Some images were considered not to be adequate for this study and were excluded because of the poor image quality and a very large lesion size. Images with architectural distortion and asymmetric density findings were not included in this study, because of the small number of available cases. However, in the future, these findings should also be included. The image database for this study consisted of 728 ROIs with malignant masses and 840 ROIs with benign masses.
Before the actual study, we conducted pilot studies with three observers. In these pilot studies, observers were shown one unknown image at a time and asked to provide their confidence level of the lesion being malignant on a continuous rating scale from “definitely benign” to “definitely malignant.” After the first rating, a set of four benign and four malignant similar images were selected and presented as most similar to the unknown image in each of the benign and malignant groups, and the observers were asked to reconsider their confidence level. In the pilot studies, the unknown masses were selected randomly. These pilot studies revealed two aspects of observers’ behavior when presented the similar images. One was that radiologists were sometimes confused by similar images because an unknown image looked similar to both benign and malignant known images. Another finding was that, if radiologists were very confident of their decisions without CAD, they were unlikely to be influenced by the presentation of similar images. The result of this pilot study indicated that the presentation of atypical “benign-looking” malignant and “malignant-looking” benign cases would not be helpful, but rather harmful; therefore, only “textbook-type” malignant and benign masses that most experienced radiologists would consider correctly to be malignant and benign should be included in the “similar-image” database. In addition, for the purpose of evaluating the effect of similar images in the laboratory observer study setting, the unknown cases should include a large fraction of moderately difficult cases.
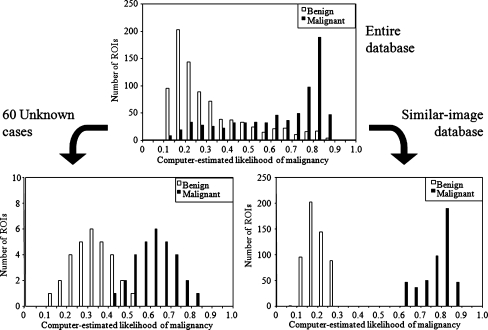
In order to include a large fraction of moderately difficult and indeterminate cases in the observer performance study, we selected the unknown cases by use of a stratified randomization method based on the computer-estimated likelihood of malignancy. The likelihood of malignancy between 0 and 1, corresponding to “definitely benign” and “definitely malignant,” respectively, was determined by an ANN, which was trained with nine image features, including the effective diameter, circularity, elliptical irregularity, two measures of contrast of the mass, standard deviation of pixel values in margin areas, ratio of the standard deviation of pixel values to the mean pixel value inside the mass, full-width at half maximum of modified radial gradient histogram, and mean edge gradient. The definitions of these features are provided elsewhere20 The radial gradient is a measure that can indicate the smoothness or the spicularity in the margin of a mass. The area under the ROC curve for distinction between the 840 benign masses and 728 malignant masses was 0.870 by use of a leave-one-case-out test method, in which all the ROIs obtained from the same patient were removed from the training set at once. Based on this likelihood, all cases in the database were stratified into 20 groups, with increments of 0.05, as shown in the top part of Fig. 1. Thirty malignant and 30 benign masses were randomly selected to serve as “unknown” cases from the respective groups so that the likelihood of malignancy for the malignant unknown masses and benign unknown masses were approximately normally distributed between 0.40 and 0.85 and between 0.10 and 0.55, respectively, as shown on the bottom left of Fig. 1. It is apparent in the figures that the fraction of definitive cases, i.e., cases with the likelihood above 0.75 and below 0.2 are greatly reduced compared to the entire database.
Fig. 1.
Distributions of the computer-estimated likelihood of malignancy for the benign and malignant masses in the entire database (top), those used as unknown cases in the observer study (bottom left), and those in the similar-image database for the observer study (bottom right).
For the “similar-image” database, relatively typical benign and malignant cases should be included; therefore, malignant masses with the likelihood of malignancy higher than 0.6 and benign masses with the likelihood lower than 0.3 were included in the “similar-image” database. In addition, if a mass was not clearly visible due to overlapping tissue, it was not included in the “similar-image” database because such a mass would not provide useful information to the observers. All of the ROIs obtained from the patients whose images were included in the 60 unknown images were excluded from the “similar-image” database. As a result, similar image database consisted of 365 malignant and 442 benign masses, as shown on the bottom right of Fig. 1.
For each unknown image, eight malignant and eight benign similar images were selected by use of the size of masses and the psychophysical similarity measure. If the effective diameter of a lesion was greater or smaller than that of an unknown lesion by 20%, the image was not considered as a potential choice for the similar images. From those within the size criterion, images with the eight highest psychophysical similarity measures in each of the malignant and benign groups were selected as the similar images. The psychophysical similarity measure was determined by use of the ANN which was trained with the 300 pairs of masses in the previous study. The details of the ANN training were described elsewhere.20,21. Each unknown mass was paired with all the masses in the similar image database, and the trained ANN provided the psychophysical measure for the each pair.
Observer Study
During the observer study, an unknown image was placed in the center of a high-resolution liquid crystal display monitor (ME511L/P4, 21.3 inch, 2,048 × 2,560 pixels, 410 cd/m2 luminance; Totoku Electric Co., Ltd.). The observers were asked to provide their confidence level that a lesion was malignant on the continuous rating scale from 0 to 1, corresponding to “definitely benign” and “definitely malignant,” respectively. After the first rating, four benign and four malignant similar images were shown on the left and right side of the unknown image, respectively. If the observers wished to observe more images and so indicated, then additional four similar images could be displayed on the monitor. In addition, if observers wanted to view some malignant masses that were not included in the similar-image database because of the low likelihood of malignancy, they were also provided for viewing; however, the use of these images was not recommended.
Eleven observers, including three attending breast radiologists, three breast imaging fellows, and five third and fourth year radiology residents, participated in the observer study. The instructions to the observers were: (1) the purpose of this study is to investigate whether providing similar known images can assist radiologists in the distinction between benign and malignant lesions on mammograms. (2) Sixty unknown cases are included in this study. A training session including seven cases is provided at the beginning of the study. (3) You are asked to provide your confidence level regarding the malignancy (or benignity) of a lesion on a bar by use of a mouse, first without similar images, and then with the similar images. (4) For each unknown case, four most similar images each from benign and malignant lesions in the database are provided. You may observe an additional four similar images by clicking on a “show similar images 5–8” button. The similar image database does not include “potentially confusing” benign cases with high probability of malignancy and malignant cases with low probability of malignancy. If desired, and if available, those malignant cases with very low scores can be observed by clicking on “show rare malignant images”; however, we do not encourage observers to use them more than necessary. (5) There is no time limit. The result was evaluated by use of multi-reader multi-case ROC analysis.24
This study was approved by the Institutional Review Board at the University of Chicago. Patients’ informed consent was waived under the IRB for this research because the DDSM does not include any identifiable patient health information. Consent forms for the observers were obtained.
Results
The areas under the ROC curves (AUCs) without and with the presentation of similar images for individual observers are summarized in Table 1. The mean AUCs by 11 radiologists were 0.783 and 0.784 without and with similar images, respectively. Overall, there was no difference in terms of the AUCs without and with similar images. However, there were many cases in which similar images were helpful, whereas there were only a few cases in which similar images caused detrimental effects.
Table 1.
AUC for Distinction Between the Benign and Malignant Masses Without and With Similar Images for Individual Observers and Group Means [95% Confidence Interval]
| AUC | |||
|---|---|---|---|
| Without | With | ||
| Breast radiologist | A | 0.847 | 0.825 |
| B | 0.756 | 0.728 | |
| C | 0.812 | 0.845 | |
| D | 0.825 | 0.796 | |
| E | 0.749 | 0.722 | |
| F | 0.818 | 0.850 | |
| Radiology residents | G | 0.788 | 0.836 |
| H | 0.750 | 0.800 | |
| I | 0.797 | 0.767 | |
| J | 0.751 | 0.696 | |
| K | 0.721 | 0.755 | |
| 6 breast radiologists | 0.801 [0.719, 0.883] | 0.794 [0.698, 0.891] | |
| 5 radiology residents | 0.762 [0.690, 0.833] | 0.771 [0.676, 0.866] | |
| All radiologists | 0.783 [0.709, 0.858] | 0.784 [0.698, 0.869] | |
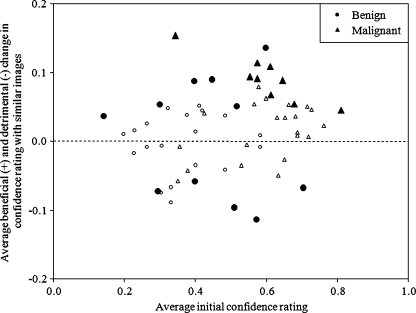
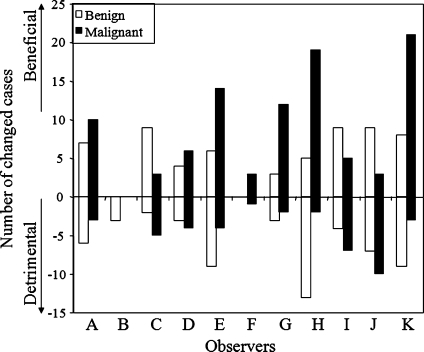
Figure 2 shows the relationship between the average initial confidence levels without similar images and the average beneficial changes (and detrimental changes in the negative direction) by the 11 radiologists. The larger closed marks indicate the cases in which the 95% confidence intervals of the mean changes among the 11 radiologists were above or below zero, and thus the mean changes were significantly different from zero. The results indicate that there were six benign and nine malignant cases for which, on average, the presentation of similar images had a beneficial effect. On the other hand, the presentation of similar images had a detrimental effect for five benign masses. If a change in confidence levels larger than 0.1 was considered a beneficial or detrimental change, the number of beneficial changes was larger than that of detrimental changes for nine of the observers, except observers B and J, as shown in Fig. 3. The average number of cases with beneficial changes was 14.2, which was 5.1 larger than that with detrimental changes (p = 0.02). The threshold of 0.1 was employed because the average change for the 60 cases by 11 observers was 0.10, thus the random variation was expected to be much smaller than 0.1. This trend did not change if the threshold of 0.05 (6.6 larger number of cases with beneficial effect, p = 0.002) or 0.15 (2.7, p = 0.02) was employed.
Fig. 2.
Relationship between the average initial confidence levels of malignancy and the average change in confidence levels after viewing of the similar images by 11 observers. Larger closed marks indicate the cases in which 95% confidence intervals for the mean changes do not include zero.
Fig. 3.
Numbers of cases for which confidence levels were changed by more than 0.1 beneficially and detrimentally for each observer after viewing of similar images.
Discussion
In this study, the effect of the presentation of similar images in the distinction between benign and malignant masses was evaluated. Although similar images had beneficial effects for many cases, the result of the ROC analysis was different from those in previous studies.13,14,18 We analyzed why the similar images caused some observers to change their confidence levels in the opposite direction from the correct diagnosis. There could be several reasons for this result. We attempted to categorize these detrimental cases into three groups: mainly due to the characteristics of the unknown lesions, characteristics of similar images, and the level of the observers’ expertise.
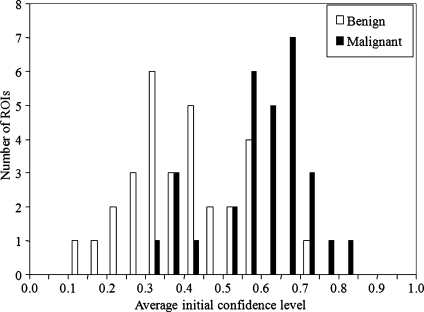
In the selection of the unknown cases, we attempted to include moderately difficult cases based on the likelihood of malignancy that was estimated by a computer. It may seem easy to separate the malignant masses from the benign masses at the bottom left figure in Fig. 1. However, the computer estimates would be different from the judgment of the likelihood of malignancy by radiologists. In fact, Fig. 4 shows the distributions of the average confidence levels of malignancy for the 60 cases by the 11 radiologists. It should be noted that the distributions in Fig. 4 are noticeably different from those in the bottom left figure of Fig. 1. In particular, the overlap of the two groups is larger, thus indicating that some cases were very challenging. When an unknown lesion is very difficult, i.e., when it is a benign-looking malignant or malignant-looking benign mass, radiologists’ initial judgment could be reinforced incorrectly by use of the similar images. In this study, there were two malignant and two benign masses for which the 95% confidence intervals of the radiologists’ mean initial ratings were below 0.5 and above 0.5, respectively.
Fig. 4.
Distributions of average initial confidence levels of malignancy for the unknown cases by the 11 observers.
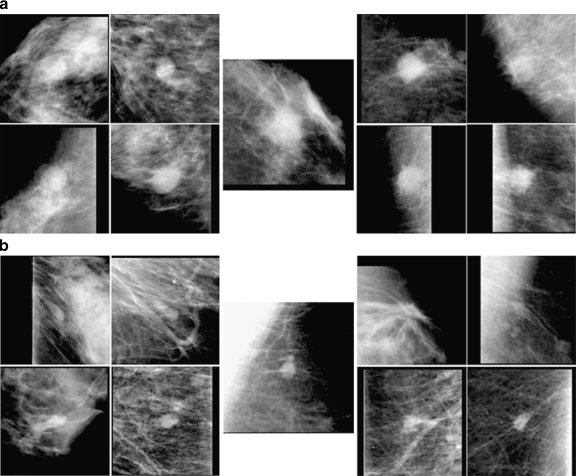
Figure 5 shows two such cases with the selected four benign similar images on the left and four malignant similar images on the right. The top image set (a) shows the benign unknown mass, in which five observers who initially gave high (>0.7) malignancy ratings did not change their ratings by more than 0.1, whereas six observers gave initial malignancy ratings between 0.5 and 0.7, and they increased their confidence levels toward malignancy. The bottom image set (b) shows a malignant mass, in which four observers decreased their confidence levels by more than 0.1 toward benignity, and seven observers kept their rating within 0.1, except for one observer whose initial rating was very low (0.15). Therefore, in these cases, most observers became more confident, incorrectly, of their initial “incorrect” judgment by viewing the similar images.
Fig. 5.
Malignant-looking benign unknown mass (top center) and benign-looking malignant mass (bottom center) and their selected similar benign (left) and malignant (right) masses.
The presentation of similar images would not be helpful and probably would be “hopeless” for these benign-looking malignant and malignant-looking benign cases. Stomper et al.25 reported that in their study, out of 27 cancers, three (11%) were mammographically well defined. Based on the predictive values of mammographic mass signs reported by Moskowitz,26 the fraction of masses with benign sign that were found to be malignant is small, about 2% in which a half of them were minimal cancer. In addition, it can be estimated that the fraction of benign cases with the definitely malignant sign is very small, 0.5% (5/953). Therefore, it may be appropriate to read them accordingly on mammograms. However, these four cases may have had a strong effect on the result of the ROC analysis, because usually the result of ROC analysis would be strongly influenced by the overlapping tail portions of binormal curves. For these cases, additional examinations, such as breast ultrasound or breast MRI, can be useful.
The second reason for the detrimental effect can be related to the scheme of selecting similar images and the similar-image database. There were six unknown cases for which the breast radiologists on average changed their confidence levels in the detrimental direction by more than 0.05, and at least two of these levels changed by more than 0.1. In these cases, either the selected known images were not very similar to the unknown case, or some of the selected known images included benign-looking malignant masses or malignant-looking benign masses.
We selected the similar images based on the psychophysical similarity measure. Although the correlation between the radiologists’ subjective similarity ratings and the psychophysical similarity measures was relatively high, the psychophysical measures were not perfect. For some cases, there might not be actually similar images in a small number of top four selected images. In this study, the unknown cases were selected semi-randomly based on the computer-estimated likelihood of malignancy, and other characteristics such as the size of lesions were not considered. As a result, the unknown masses included a larger fraction of small lesions less than 10 mm (40%), compared to that in the entire database (34%). We selected similar images in which the effective diameters of masses were within 20% of that of the unknown mass, because it may be difficult to recognize lesions to be similar if their sizes are very different. However, this selection rule might have been too strict, especially for those small masses. In addition, it may be more difficult to determine the margin features accurately for small lesions because the area in which the feature is determined becomes smaller as the size of the lesion becomes smaller. Therefore, the selection of similar images for small lesions and the relationship between the lesion similarity and the size need to be investigated further.
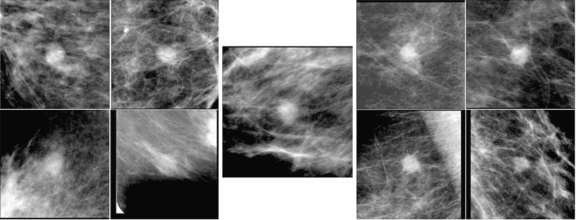
For providing potentially useful, textbook-type cases as similar images, we tried to exclude potentially confusing, benign-looking malignant masses and malignant-looking benign masses from the similar-image database. However, not all of these cases were removed because of the use of the computer-estimated likelihood of malignancy, which can be unreliable in some cases. Figure 6 shows the benign unknown mass and the selected similar images. Most observers correctly interpreted the unknown mass as low suspiciousness of malignancy initially. However, the bottom two benign masses were not very useful because they are not very similar to the unknown mass, whereas the top right malignant mass is quite benign-looking and somewhat similar to the unknown mass. Although, in retrospective review by a breast radiologist, most radiologists should consider that the unknown mass is more similar to the benign masses, some observers may have been concerned after reviewing the benign-looking malignant mass and increased their ratings. In the future, the similar-image database should be organized adequately so that it includes cases that are really useful to radiologists.
Fig. 6.
Benign unknown mass with the selected similar images. The malignant mass in the top right image is quite benign-looking.
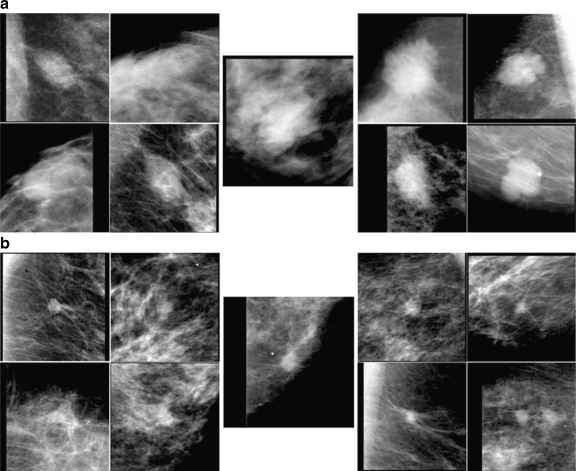
The third reason for the detrimental effect might be related to the observers’ levels of expertise. Some of the past observer studies18,27,28 indicated that the gain by use of CAD would be greater for less experienced observers; however, in this study, the result indicated that, although the overall effect of the similar images seemed to be more useful to the residents, the detrimental effect could also be greater. There were two cases in which the similar images had different effects for the six breast radiologists and for the five residents; these cases are shown in Fig. 7. The top set (a) shows a benign unknown mass with the selected similar images. Although the average initial confidence levels by the two groups of observers were nearly equal (0.32 and 0.34), four of the five residents increased their confidence levels detrimentally by more than 0.1, whereas one breast radiologist decreased his/her rating, and others remained almost unchanged. The bottom set (b) in Fig. 7 shows a malignant unknown mass with the selected benign and malignant similar images. In this case, all six breast radiologists initially provided confidence levels higher than 0.5, and one of them increased his/her level by more than 0.1, whereas others kept their levels almost unchanged. On the other hand, the initial confidence levels of the five residents ranged from 0.39 to 0.75. One of them increased his/her confidence level after viewing the similar images; however, the other four decreased their levels detrimentally by more than 0.1. These results indicate that some residents could not use the similar images adequately.
Fig. 7.
Benign unknown mass (top center) and malignant unknown mass (bottom center), to which the six breast radiologists and five residents reacted differently.
In this study, equal numbers of malignant and benign similar images were presented during the observer study. It can sometimes be difficult to use similar images in this format, because observers must “look for” similar images and judge similarities of an unknown image to the known images. As a result, the observers might react differently to some cases. Another research group13,16 has chosen, instead, to select and present the set of known images without regard to whether each is benign or malignant. This approach can be thought of as somewhat analogous to providing the likelihood of malignancy of the unknown lesion. Therefore, the observers may be influenced more strongly by the fractions of benign and malignant similar images than by the actual similarities of those images. In our study, we presented the images from the two pathology groups because, in the other format, the selection of similar images could be influenced by the prevalence of malignant and benign images in the database. Moreover, if an unknown image is mistakenly surrounded by images in the opposite pathology group, or if the similarities of an unknown image and known images in the opposite (incorrect) pathology group were slightly greater than those in the same (correct) pathology group, the fraction of lesions in two pathology groups may influence observers detrimentally. However, for non-expert observers, presentation of both similar images and the likelihood of malignancy may be useful. One of the limitations of this study is that the number of cases might have been too small. If a larger number of cases had been included, the fraction of atypical benign-looking malignant and malignant-looking benign unknown cases and their effect might have been smaller.
Conclusion
Although there was no improvement in the distinction between benign and malignant masses in terms of the AUC, the similar images were beneficial for many cases. The automated selection and presentation of similar images may also be useful for teaching and training purpose. For future improvement in selection of similar images and the effective utilization of known database, the detailed analysis of the observer study result can be important. In this study, we discussed the potential problems of inclusion of benign-looking malignant and malignant-looking benign masses as unknown images for the evaluation of the effect of the CAD system and also as known similar images for the diagnostic aid. The analysis of our results can be important and useful in the future development and improvement of CAD systems. This was our first observer study for evaluation of the effect of the presentation of similar images in the diagnosis of breast lesions on mammograms. We believe that the presentation of similar images have a potential to help radiologists if the computerized system is properly improved and when radiologists become more familiar with the system, and that the effect of the presentation of similar images to radiologists must be investigated further.
References
- 1.Hall FM, Storella JM, Silverstone DZ, Wyshak G. Nonpalpable breast lesions: Recommendations for biopsy based on suspicion of carcinoma at mammography. Radiology. 1988;167:353–358. doi: 10.1148/radiology.167.2.3282256. [DOI] [PubMed] [Google Scholar]
- 2.Kopans DB, Moore RH, McCarthy KA, Hall DA, Hulka CA, Whitman GJ, Slanetz PJ, Halpern EF. Positive predictive value of breast biopsy performed as a result of mammography: There is no abrupt change at age 50 years. Radiology. 1996;200:357–360. doi: 10.1148/radiology.200.2.8685325. [DOI] [PubMed] [Google Scholar]
- 3.Sickles EA, Miglioretti DL, Ballard-Barbash R, Geller BM, Leung JWT, Rosenberg RD, Smith-Bingman R, Yankaskas BC. Performance benchmarks for diagnostic mammography. Radiology. 2005;235:775–790. doi: 10.1148/radiol.2353040738. [DOI] [PubMed] [Google Scholar]
- 4.Chan HP, Sahiner B, Roubidoux MA, Wilson TE, Akler DD, Paramagul C, Newman JS, Sanjay-Gopal S. Improvement of radiologists’ characterization of mammographic masses by using computer-aided diagnosis: An ROC study. Radiology. 1999;212:817–827. doi: 10.1148/radiology.212.3.r99au47817. [DOI] [PubMed] [Google Scholar]
- 5.Jiang Y, Nishikawa RM, Schmidt RA, Metz CE, Giger ML, Doi K. Improving breast cancer diagnosis with computer-aided diagnosis. Acad Radiol. 1999;6:22–33. doi: 10.1016/S1076-6332(99)80058-0. [DOI] [PubMed] [Google Scholar]
- 6.Doi K. Current status and future potential of computer-aided diagnosis in medical imaging. Br J Radiol. 2005;78:S3–S19. doi: 10.1259/bjr/82933343. [DOI] [PubMed] [Google Scholar]
- 7.Doi K. Computer-aided diagnosis in medical imaging: Historical review, current status and future potential. Comput Med Imaging Graph. 2007;31:198–211. doi: 10.1016/j.compmedimag.2007.02.002. [DOI] [PMC free article] [PubMed] [Google Scholar]
- 8.Doi K. Computer-aided diagnosis moves from breast to other systems. Diagnostic Imaging. 2007;29:37–40. [Google Scholar]
- 9.Muramatsu C: Investigation of similarity measures for selection of similar images in computer-aided diagnosis of breast lesions on mammograms. (Ph.D. Dissertation, The University of Chicago, Chicago, IL) Ann Arbor, MI: ProQuest/UMI, 2008
- 10.Kumazawa S, Muramatsu C, Li Q, Li F, Shiraishi J, Caligiuri P, Schmidt RA, MacMahon H, Doi K. An investigation of radiologists’ perception of lesion similarity: Observations with paired breast masses on mammograms and paired lung nodules on CT images. Acad Radiol. 2008;15:887–894. doi: 10.1016/j.acra.2008.01.012. [DOI] [PubMed] [Google Scholar]
- 11.Swett HA, Fisher PR, Cohn AI, Miller PL, Mutalik PG. Expert system-controlled image display. Radiology. 1989;172:487–493. doi: 10.1148/radiology.172.2.2664871. [DOI] [PubMed] [Google Scholar]
- 12.Aisen AM, Broderick LS, Winer-Muram H, Brodley CE, Kak AC, Pavlopoulou C, Dy J, Shyu CR, Marchiori A. Automated storage and retrieval of thin-section CT images to assist diagnosis: System description and preliminary assessment. Radiology. 2003;228:265–270. doi: 10.1148/radiol.2281020126. [DOI] [PubMed] [Google Scholar]
- 13.Li Q, Li F, Shiraishi J, Katsuragawa S, Sone S, Doi K. Investigation of new psychophysical measures for evaluation of similar images on thoracic CT for distinction between benign and malignant nodules. Med Phys. 2003;30:2584–2593. doi: 10.1118/1.1605351. [DOI] [PubMed] [Google Scholar]
- 14.Sklansky J, Tao EY, Bazargan M, Ornes CJ, Murchison RC, Teklehaimanot S. Computer-aided, case-based diagnosis of mammographic regions of interest containing microcalcifications. Acad Radiol. 2000;7:395–405. doi: 10.1016/S1076-6332(00)80379-7. [DOI] [PubMed] [Google Scholar]
- 15.Giger ML, Huo Z, Vyborny CJ, Lan L, Bonta I, Horsch K, Nishikawa RM, Rosenbourgh I. Intelligent CAD workstation for breast imaging using similarity 167 to known lesions and multiple visual prompt aids. Proc SPIE. 2002;4684:768–773. doi: 10.1117/12.467222. [DOI] [Google Scholar]
- 16.El-Naqa I, Yang Y, Galatsanos NP, Nishikawa RM, Wernick MN. A similarity learning approach to content-based image retrieval: Application to digital mammography. IEEE Trans Med Imaging. 2004;23:1233–1244. doi: 10.1109/TMI.2004.834601. [DOI] [PubMed] [Google Scholar]
- 17.Zheng B, Lu A, Hardesty LA, Sumkin JH, Hakim CM, Ganott MA, Gur D. A method to improve visual similarity of breast masses for an interactive computer-aided diagnosis environment. Med Phys. 2006;33:111–117. doi: 10.1118/1.2143139. [DOI] [PubMed] [Google Scholar]
- 18.Horsch K, Giger ML, Vyborny CJ, Lan L, Mendelson EB, Hendrick ER. Classification of breast lesions with multimodality computer-aided diagnosis: Observer study results on an independent clinical data set. Radiology. 2006;240:357–368. doi: 10.1148/radiol.2401050208. [DOI] [PubMed] [Google Scholar]
- 19.Muramatsu C, Li Q, Suzuki K, Schmidt RA, Shiraishi J, Newstead G, Doi K. Investigation of psychophysical measure for evaluation of similar images for mammographic masses: Preliminary results. Med Phys. 2005;32:2295–2304. doi: 10.1118/1.1944913. [DOI] [PubMed] [Google Scholar]
- 20.Muramatasu C, Li Q, Schmidt RA, Shiraishi J, Suzuki K, Newstead G, Doi K: Determination of subjective and objective similarity for pairs of masses on mammograms for selection of similar images. Proc SPIE 65141I 1–65141I 9, 2007
- 21.Muramatsu C, Li Q, Schmidt RA, Shiraishi J, Doi K. Determination of similarity measures for pairs of mass lesions on mammograms by use of BI-RADS lesion descriptors and image features. Acad Radiol. 2009;16:443–449. doi: 10.1016/j.acra.2008.10.012. [DOI] [PubMed] [Google Scholar]
- 22.Heath M, Bowyer K, Kopans D, Moore R, Kegelmeyer P. Current states of the digital database for screening mammography. Digital mammography. Dordrecht: Kluwer Academic Publishers; 1998. [Google Scholar]
- 23.University of South Florida. Available at http://marathon.csee.usf.edu/Mammography/Database.html.
- 24.Dorfman DD, Berbaum KS, Metz CE. Receiver operating characteristic rating analysis: Generalization to the population of readers and patients with the jackknife method. Invest Radiol. 1992;27:723–731. doi: 10.1097/00004424-199209000-00015. [DOI] [PubMed] [Google Scholar]
- 25.Stomper PC, Davis SP, Weidner N, Meyer JE. Clinically occult, noncalcified breast cancer: serial radiologic-pathologic correlation in 27 cases. Radiology. 1988;169:621–626. doi: 10.1148/radiology.169.3.2847231. [DOI] [PubMed] [Google Scholar]
- 26.Moskowitz M. The predictive value of certain mammographic signs in screening for breast cancer. Cancer. 1983;51:1007–1011. doi: 10.1002/1097-0142(19830315)51:6<1007::AID-CNCR2820510607>3.0.CO;2-P. [DOI] [PubMed] [Google Scholar]
- 27.Huo Z, Giger ML, Vyborny CJ, Metz CE. Breast cancer: Effectiveness of computer-aided diagnosis-observer study with independent database of mammograms. Radiology. 2002;224:560–568. doi: 10.1148/radiol.2242010703. [DOI] [PubMed] [Google Scholar]
- 28.Feig SA, Sickles EA, Evans WP, Linver MN. Re: Changes in breast cancer detection and mammography recall rates after the introduction of a computer-aided detection system. J Natl Cancer Inst. 2004;96:1260–1261. doi: 10.1093/jnci/djh257. [DOI] [PubMed] [Google Scholar]


