
Figure 4. The convex loops of GPIX preserve the interaction of GPIX with GPIbβ, in the context of full-length subunits.
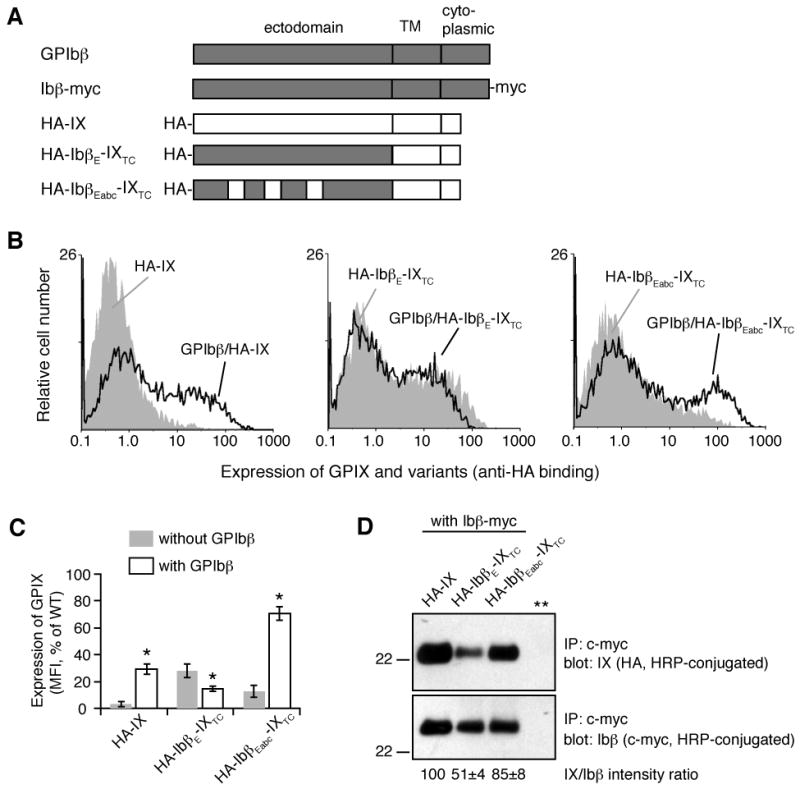
(A) Illustration of GPIbβ and GPIX constructs used. The HA tag was attached to the N-terminus of mature GPIX and its variants for consistent measurements. The c-myc tag was appended to the C-terminus of GPIbβ for the co-IP experiment. IXTC denotes the GPIX transmembrane and cytoplasmic domains. HA-IX is essentially HA-IXE-IXTC. (B) Overlaid histograms showing effects of co-expressing GPIbβ on the expression level of HA-IX (left), HA-IbβE-IXTC (middle), or HA-IbβEabc-IXTC (right) on the surface of transiently transfected CHO cells as detected by flow cytometry after immunostaining with anti-HA antibody. Grey peak: without GPIbβ; solid line: with GPIbβ. Expression levels of GPIX derivatives in CHO cells transfected with GPIbα/GPIbβ/HA-IX or with empty vectors were not shown here but essentially the same as those shown in Figure 2C. (C) Quantitative representation of surface expression levels of GPIX. The measured mean fluorescence intensity (MFI), obtained for the entire cell population (10,000 cells per sample), was normalized with the GPIX expression level in CHO cells transfected with GPIbα/GPIbβ/HA-IX being 100% and cells transfected with empty vectors 0%[8]. All data are presented as the mean ± SD from 4 independent experiments. Groups were compared using the nonpaired t test; *, p < 0.01. (D) IbβEabc helps to preserve GPIX association with GPIbβ. After transient transfection with Ibβ-myc and individual GPIX variants as noted, proteins in cells lysate were immunoprecipitated by anti-myc antibody, separated in a 12% Tris-glycine SDS gel, transferred to PVDF membrane and blotted by HRP-conjugated anti-HA antibody (for GPIX variants) or HRP-conjugated anti-myc antibody (for Ibβ-myc). The negative control (** lane) is as described in Figure 2B. The ratio of IX and Ibβ band intensities was quantitated and expressed as a percentage of that for HA-IX. The data are presented as the mean ± SD from 4 independent experiments.