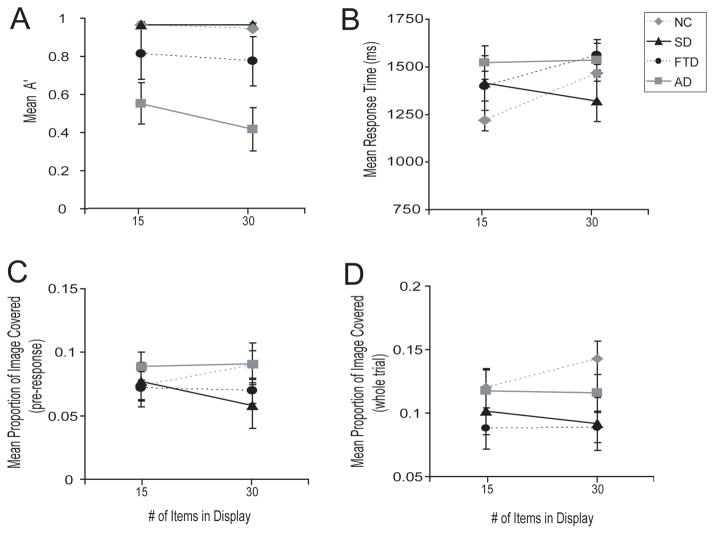
Figure 3. Interaction between groups and the display size increase from 15–30 items in the conjunction search task on four measures.
Panel A indicates accuracy, panel B indicates response time, panel C shows saccade spread until the response was detected, and panel C shows saccade spread across the whole trial. Note that in panels B-D, SD patients and healthy controls show opposite effects of the increase in display size from 15–30. Error bars indicate standard error of the mean.

