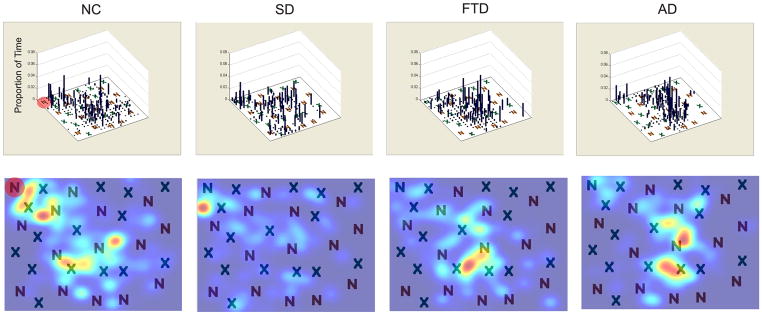
Figure 4. Examples of visual search patterns during conjunction search.
Representative plots eye movements during a conjunction search trial with a display size of 30 items. Target is shaded in red in the NC figures. The top panel shows a histogram the proportion of time spent in each part of the figure, with a density map (smoothed Gaussian distribution) of the same data shown below. The data shown here are representative of 10–14 trials in each patient group.

