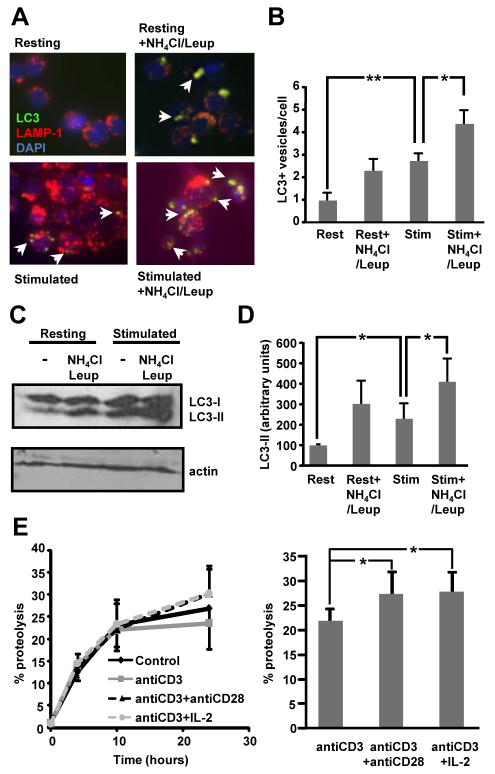
Figure 1. Macroautophagy is induced during activation in effector T helper cells.
A. Murine CD4+ were polarized to Th1 cells for 6 days and then stimulated with plate bound anti-CD3 and anti-CD28 in the presence or absence of 20 mM NH4Cl and 100 μM leupeptin (Leup). Immunofluorescence analysis was performed using antibodies against LC3 and LAMP-1. Arrows indicate the presence of LC3+ autophagic vacuoles. B. Quantification of the number of LC3 puncta per cell in resting (Rest) and stimulated (Stim) cells from 3 independent experiments (mean+SEM). C and D. Lysates from resting or plate bound anti-CD3 and anti-CD28 stimulated T cells in the presence or absence of NH4Cl and leupeptin were immunoblotted with antibodies against LC3. The blot is representative of 3 experiments that were quantified using Image J software. Results of the quantification of the levels of LC3-II relative to actin are shown in D as mean+SEM. All experiments shown in A-D were performed 4-6 h following stimulation. E. Th1 cells were labeled with [3H] Leucine for 48 h. Cells were then left resting or stimulated with either plate bound anti-CD3, anti-CD3+anti-CD28, or plate bound anti-CD3+anti-CD28+IL-2 (10 U/mL), and chased in medium containing an excess of unlabeled Leucine for 24hrs. Analysis of proteolysis rates (left) and levels of proteolysis after 24 h of stimulation (right) with or without costimulation are shown. Results are mean+SEM of calculated total levels of proteolysis from five to seven different experiments. *p<0.05; **p<0.01.

