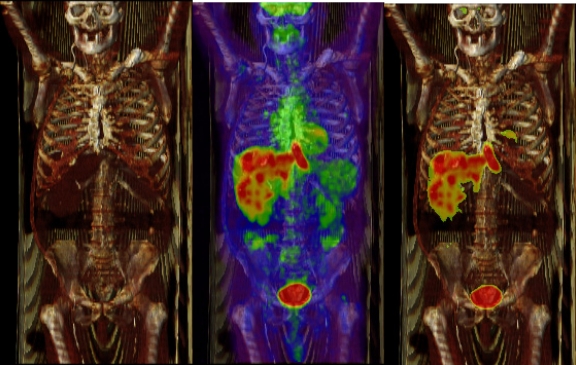
Fig 5.
The left image shows direct volume rendering of the CT. The middle image is the fusion of maximum intensity projection of PET and direct volume rendered CT. A conventional colormap similar to Figure 1a is used for PET and the colormap is linearly mapped to SUV from 0 to 4. The right image is similarly rendered as the middle image, except a colormap similar to Figure 1b is used to expose the underline anatomic context.

