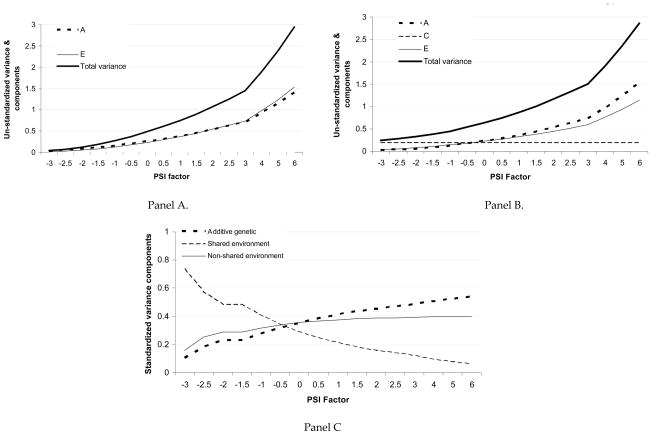
Figure 2.
Panel A represents results from the moderating influences model. The total variance as well as the contributions of additive genetic (A) and non-shared environmental factors (E) are shown – as noted in Table 3, shared environmental influences (C) were not statistically significant here and hence, are not shown – estimates are un-standardized, such that at each level of PSI, total variance = A+E.
Panel B and C represent results from the joint correlation-moderating influences models. Panel B presents unstandardized results while panel C presents standardized variance components.

