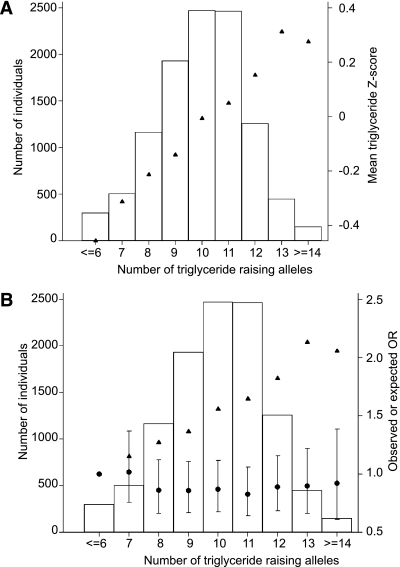
FIG. 2.
The combined impact of the 10 triglyceride-associated SNPs on circulating triglyceride levels in the Go-DARTS study type 2 diabetic case and control subjects, with triangles representing the mean triglyceride z score within each triglyceride-increasing allele group (A); and observed (circles) and expected (triangles) type 2 diabetes ORs when comparing each allele group to a reference group of those with six or fewer triglyceride-raising alleles, with 95% CIs given for the observed data points (B). Participants were grouped by total number of triglyceride-raising alleles at all 10 SNPs, and the bars represent the number of individuals in each group.

