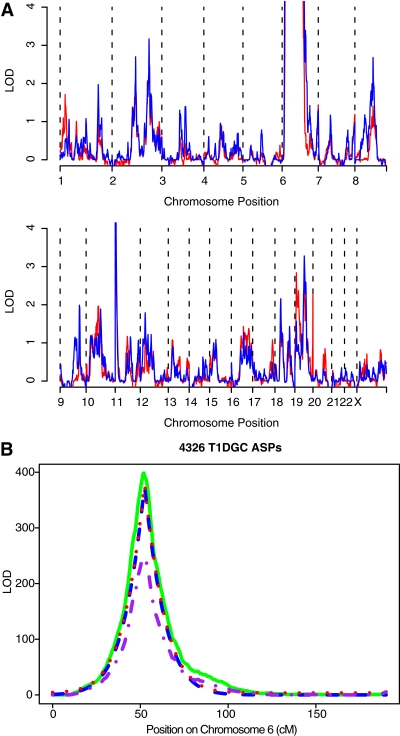
FIG. 2.
Evidence of linkage from the entire T1DGC ASP family collection. A: Pedigree files were merged from the latest set of T1DGC families and those reported earlier (4,5) (which are shown in red). LOD scores for the entire dataset were calculated as described in Fig. 1 and shown in blue.The scale is truncated at 4, so it does not indicate the height of the peaks on chromosome 6 (~400) (see B) and 11 (~5). B: Linkage of chromosome 6 markers in the T1DGC family collection. LOD scores were calculated for the complete T1DGC family collection (solid green line) and compared with the cohort 3 families (dashed purple line). In addition, LOD scores were calculated correcting for linkage to HLA: the ELOD score based on decay of linkage from HLA is shown as a dashed blue line and ELOD + 3.6 as a dotted red line. The increase in observed LOD above ELOD in the region ~90–100 cM is consistent with additional type 1 diabetes susceptibility gene(s) mapping to this region.

