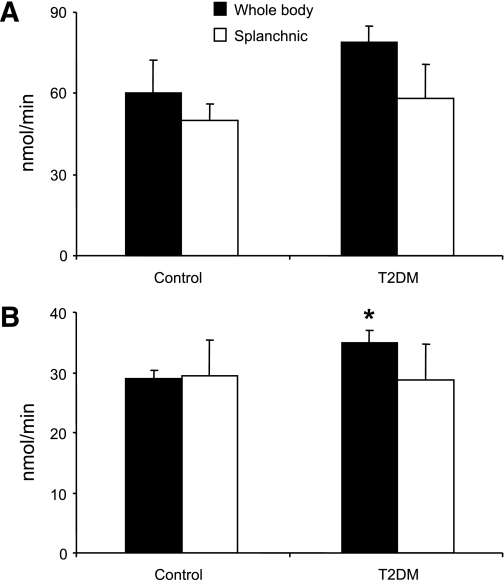
FIG. 2.
Rates of appearance of cortisol and d3-cortisol in steady state. Data are means ± SEM for rates of appearance of cortisol (A) and d3-cortisol (B) in whole body (black columns) and splanchnic tissues (white columns). *P < 0.05 for obese men with type 2 diabetes (n = 10 for arterial, n = 9 for hepatic vein samples) compared with lean control subjects (n = 7).

