FIG. 5.
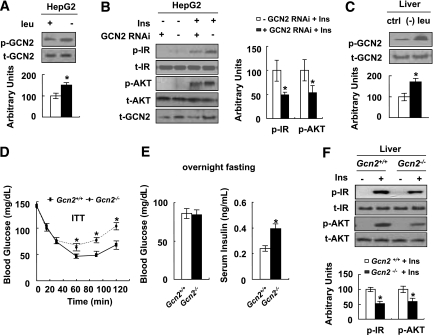
Leucine deprivation increases insulin sensitivity by activation of GCN2. A: HepG2 cells were incubated with control (+ leu) or (−) leu medium for 24 h. B: The GCN2-KO stable HepG2 (+ GCN2 RNAi) and negative control cells (− GCN2 RNAi) were incubated with (−) leu medium for 24 h and followed with (+ Ins) or without (− Ins) 100 nmol/L insulin stimulation for 20 min. Data are means ± SEM of at least three independent experiments (A and B). C: Gcn2+/+ mice were fed a control (ctrl) or (−) leu diet for 7 days. D–F: Gcn2+/+ and Gcn2−/− mice were fed a (−) leu diet for 7 days, followed by ITT (D), overnight fasting blood glucose and serum insulin measurement (E), and insulin signaling examination before (− Ins) and after (+ Ins) 2 units/kg insulin stimulation for 3 min (F). Data are means ± SEM of at least two independent experiments with mice of each group for each experiment (n = 5–6 each group). Statistical significance is calculated by two-tailed Student t test for the effects of (−) leu vs. control medium (*P < 0.01) (A), GCN2-KO vs. control cells after insulin stimulation (B), (−) leu vs. control diet (C), and Gcn2−/−vs. Gcn2+/+ mice (D and E). p-GCN2 protein (A) (top, Western blot; bottom, p-GCN2 protein relative to total protein); p-IR and p-AKT protein (B) (left, Western blot; right, quantitative measurements of p-IR and p-AKT protein relative to their total protein); p-GCN2 protein (C) (top, Western blot; bottom, p-GCN2 protein relative to total protein); ITT (D); fasting blood glucose and serum insulin (E); p-IR and p-AKT protein (F) (top, Western blot; bottom, quantitative measurements of p-IR and p-AKT protein relative to their total protein).

