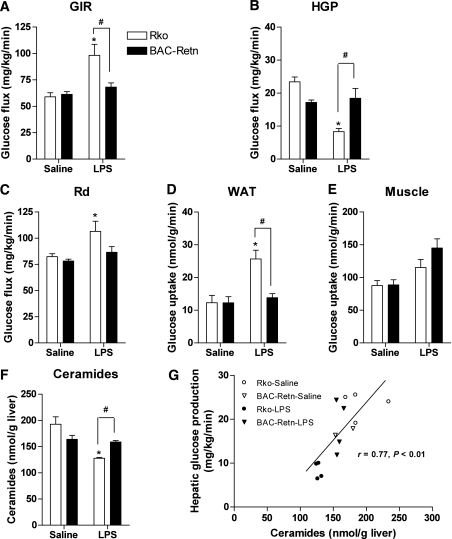
FIG. 3.
Acute endotoxemia induces hepatic and adipose tissue insulin resistance in BAC-Retn mice. A–C: Hyperinsulinemic-euglycemic clamp analysis of BAC-Retn (■) vs. Rko (□) mice (n = 4 per group) in 6 h after LPS administration. D and E: Rate of insulin-stimulated glucose uptake in WAT (D) and skeletal muscle (E). F: Total ceramides content in liver. G: Correlation between hepatic ceramide content and hepatic glucose production (HGP) during the clamp study. Data are presented with the SEM. GIR, glucose infusion rate; Rd, whole-body rate of glucose disposal. *P < 0.05 vs. saline; #P < 0.05 vs. Rko.

