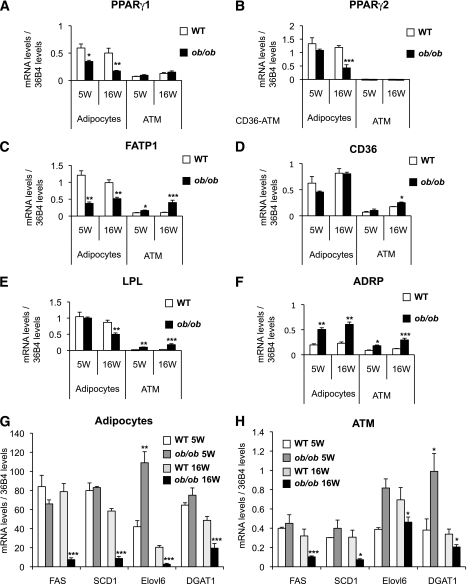
FIG. 4.
Change in expression levels of the lipid metabolism gene in ATMs and adipocytes. A–F: The expression profile of key genes of the lipid metabolism were analyzed in parallel in ATMs and adipocytes. The mRNA levels of genes key in the lipogenesis pathway have been quantified in ATMs (G) and adipocytes (H). The expression levels were normalized by the amount of 36B4. The bars represent the SEs and significant differences were as follows: *P < 0.05; **P < 0.005; ***P < 0.001. Males, n = 16 per group (see research design and methods).

