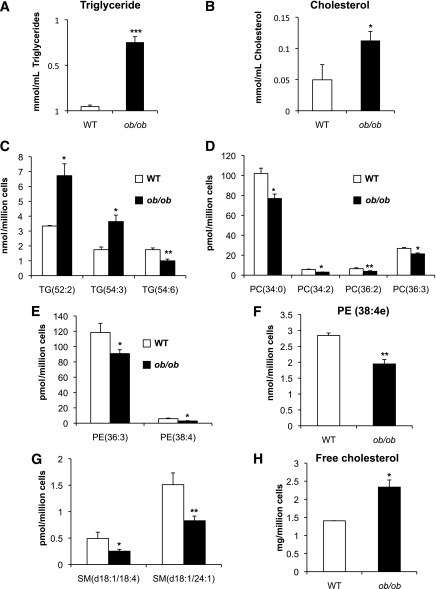
FIG. 5.
Lipidomics profile of ATMs from 16-week-old ob/ob and wild-type (WT) mice. Absolute lipid concentrations of triglycerides (A) and cholesterol (B) assessed by colorimetric method and global lipid analysis showing significantly altered triglycerides (C), phosphotidylcholines (D), plasmalogen (E), phosphatidylethanolamine (F), sphingomyelin (G), and free cholesterol (H). The bars represent the SE of means and significant differences were as follows: *P < 0.05; **P < 0.005; ***P < 0.001. Males, n = 16 per group (see research design and methods).

