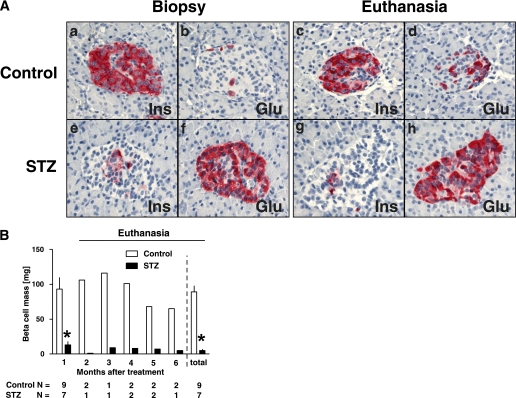
FIG. 5.
A: Islet morphology of control (a–d) and STZ (e–h) groups. As expected, there was no change in islet morphology between biopsy and euthanasia pancreas in control group. In contrast, there was a marked reduction in the number of β-cells per islet in STZ group at biopsy and euthanasia. B: β-Cell mass during the study. The β-cell mass was ∼90% decreased at biopsy (1 month after the treatment) in the STZ group compared with that of the control group. This decreased β-cell mass did not recover during the study. Glu, glucagon; Ins, insulin. (A high-quality digital representation of this figure is available in the online issue.)

